


Agilent 86038B Photonic Dispersion and Loss Analyzer, Second Edition
39
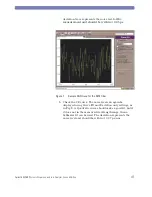
repeatability and should be within a tolerance of
\
0.03
ps. The offset of the data values from 0 ps. is an indication
of the accuracy and should be within a tolerance of
\
0.05
ps. (Note however that temperature changes to the patch-
cord can cause offsets larger than this.)
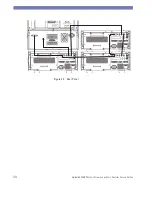
Figure 5
Sample GD trace
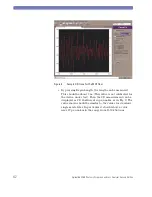
d Check the DGD curve. Since the normalization and
measurement are made with the same connection and the
patch-cord has little DGD, the displayed DGD should be
close to 0 ps, as in Fig. 6. The variation from zero is a
measure of the noise and any intrinsic offset and should
be within a tolerance of 0.1ps. Note also that the average
DGD, PMD, can be displayed in the Define Trace tab and
in the Information Field in the upper right corner. The
value here should be less than 0.07 ps.
Summary of Contents for 86038B
Page 1: ...Agilent 86038B Photonic Dispersion and Loss Analyzer User s Guide ...
Page 4: ...4 ...
Page 20: ...20 Agilent 86038B Photonic Dispersion and Loss Analyzer Second Edition ...
Page 34: ...34 Agilent 86038B Photonic Dispersion and Loss Analyzer Second Edition Figure 2 b Rear Panel ...
Page 78: ...78 Agilent 86038B Photonic Dispersion and Loss Analyzer Second Edition ...
Page 92: ...92 Agilent 86038B Photonic Dispersion and Loss Analyzer Second Edition ...
Page 202: ...202 Agilent 86038B Photonic Dispersion and Loss Analyzer Second Edition End Sub ...
Page 348: ...348 Agilent 86038B Photonic Dispersion and Loss Analyzer Second Edition ...
Page 349: ......


