


15
1.
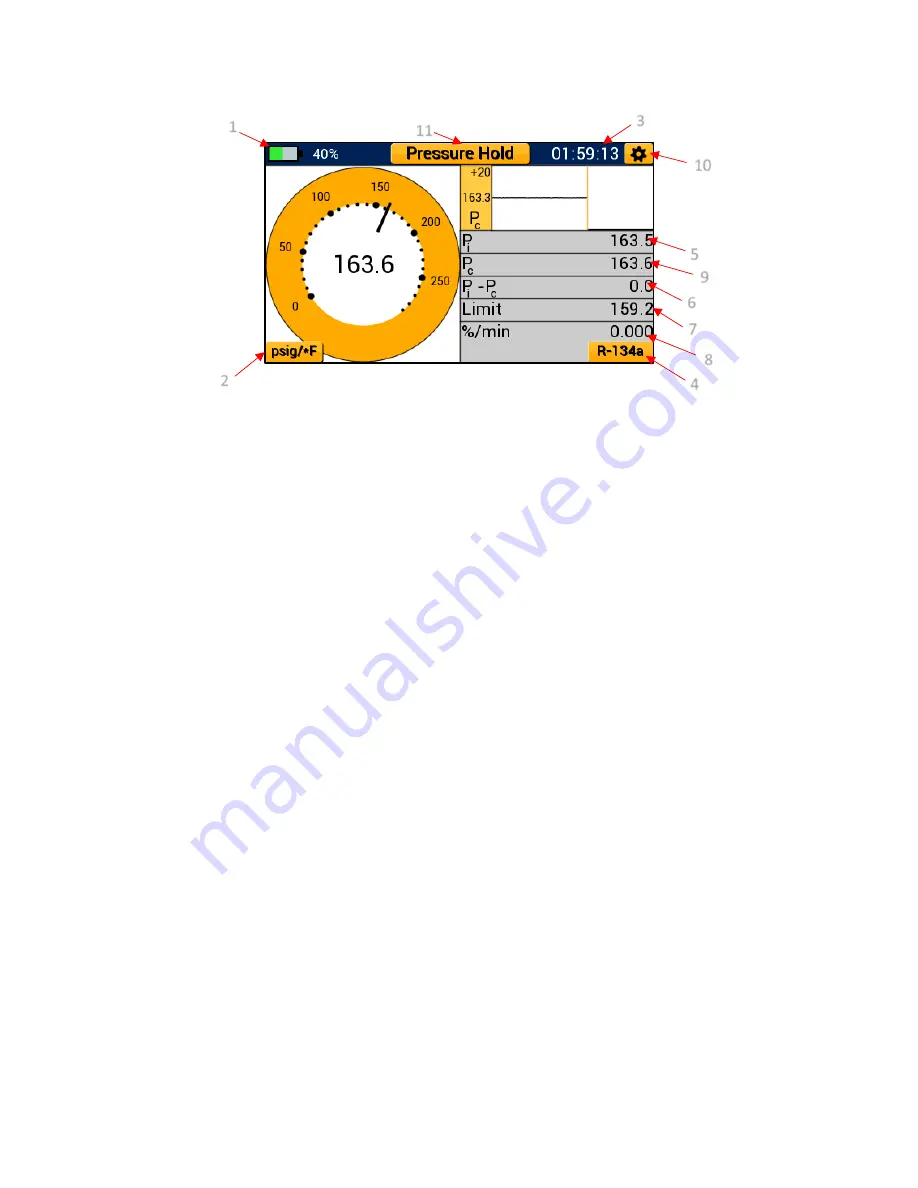
Battery Indicator
2.
Currently Selected Units – Unit Settings Menu Shortcut
3.
Hold Timer
4.
Currently Selected Refrigerant – Refrigerant Settings Menu Shortcut
5.
Initial Pressure (Pi)
6.
Change in Pressure (Pi-Pc)
7.
Pressure Limit (Limit)
8.
Rate of Change (%/min)
9.
Current System Pressure (Pc)
10.
General Settings Button
11.
Currently Selected Mode – Modes Button
Live system pressure is measured and compared to initial pressure readings to determine if the
system has lost pressure over time. Current system pressure is displayed as a digital analog gauge,
a line graph, and in a digital format displayed at the center of the analog gauge.
Interpreting the Pressure Decay Gauge:
Pressure Decay mode features a digital analog pressure gauge on the left of the display. This
gauge operates on a linear scale with minor divisions displayed as small dots and major divisions
displayed as larger dots respectively. The current system pressure is displayed in a digital format
at the center of the analog gauge. Both the current pressure measurement and gauge face will
update to reflect the currently selected pressure unit. The needle of the pressure decay gauge
adjusts in real time and can be used to visualize any fluctuations in system pressure as if using a
real analog gauge.
Interpreting the Pressure Decay Graph:
Pressure Decay mode also features a line graph which plots current system pressure readings in
real time. System pressure is plotted on a linear scale and is denoted as Pc. The current system
pressure graph utilizes an orange leader to line to plot new data from left to right. Old data is
conveniently displayed to the right of the leader line such that it can be compared to newer data.
Figure 21: Pressure Hold – Pressure Decay
Test Diagram
1
2
3
4
5
6
7
10
11
9
8
Содержание 40870
Страница 31: ...28...


