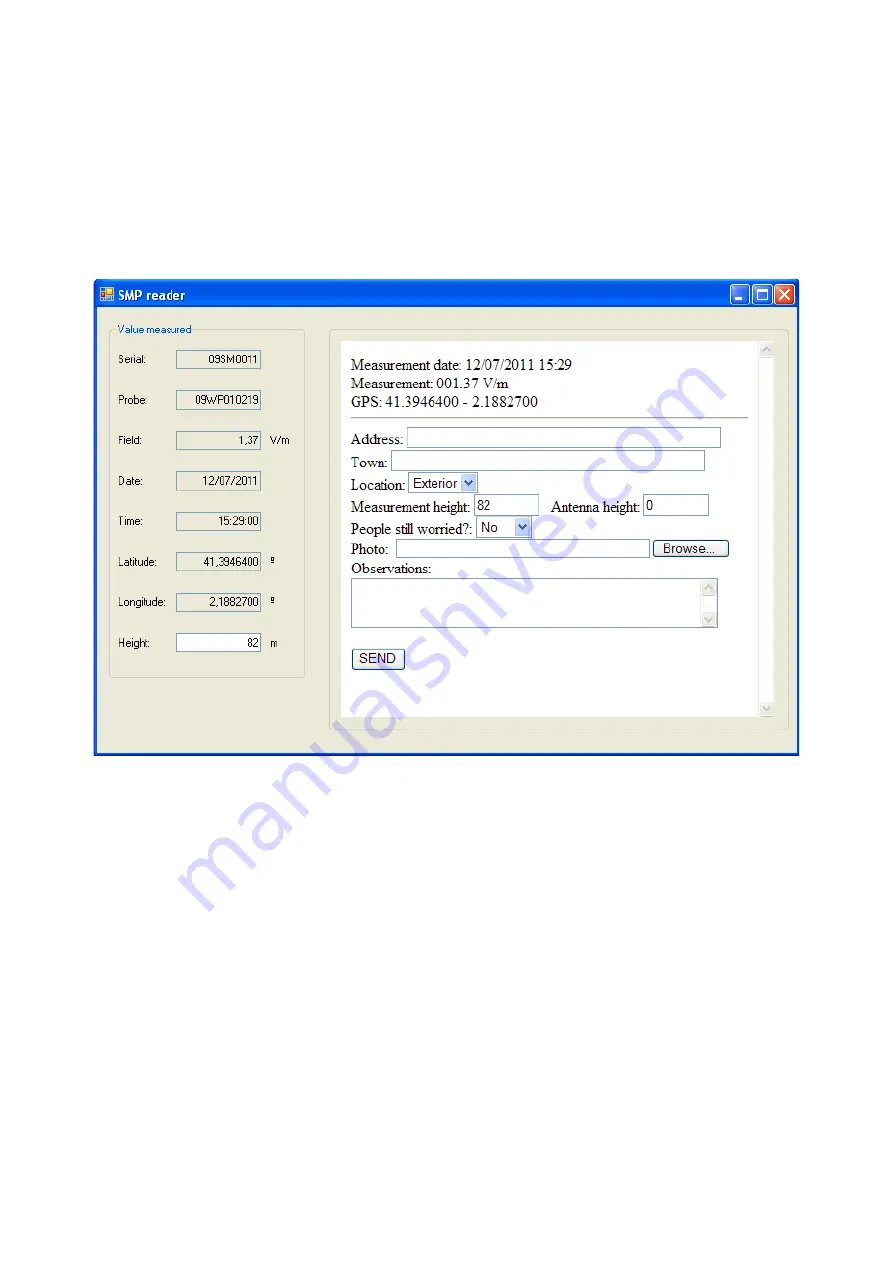
When this is done, click on “Send to control center” (if you don't have entered a valid user and
password in the option menu, you will have to enter it) it will show you a web page (fig )where
you are required to fill more data like:
–
address
–
height of the measurement and the nearest transmitter
–
a photo (if you choose a large picture, it will take some time so send it, be patient. It's
better not to send too large picture)
Figure 11:
SMP reader GIS upload information
When you have filled all values, click on send. When OK appears, you can close this window.
This measurement will appear automatically in the web site.
7.3
Real time data visualisation
This function allows instant visualization of data being measured via the USB port. When it is
switched on, the
SMP
will automatically send the following data to the PC:
•
Time and date
•
Field values: Field on the three axes and total field value
•
GPS data: Longitude, latitude and altitude
To see the data you will need to use a communication program such as Windows
Hyperterminal
, indicating the number of the serial port associated with the
SMP
(see section
). You will need to use the following configuration:
19200 bauds, 8 data bits, no parity, 1 stop bit, no flow control.
-
23
-


