


Veriteq vLog 4.4 User’s Guide
63
Pinpointing Graph Values and Times
To pin-point exact values and times on the currently-active graph:
1. Do one of the following:
• Select
Format
>
Position Cursor
.
• Press F7.
• Right-click the graph, and then select
Position Cursor
.
• Click the
Position cursor
icon on the toolbar (
).
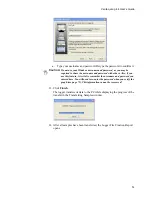
2. Position the cursor line along the X axis using the mouse or the arrow keys.
The values at the bottom left portion of the window indicate the exact date
and time where the cursor line is positioned as well as the exact values that
correspond to that point.
3. To lock the cursor in place, click the mouse or press E
NTER
.
To remove the vertical cursor bar:
1. Do one of the following:
• Select
Format
>
Remove Cursor
.
• Press F8.
• Right-click the graph, and then select
Remove Cursor
.
• Click the
Remove cursor
icon on the toolbar (
).
Adding Graph Titles
To add a descriptive title to the currently active graph:
1. Do one of the following:
• Select
Format
>
Title...
• Right-click the center of the window, just above the graph, and select
Format Title...
• Double-click the center of the window, just above the graph.
The Title window opens.
Date/time
Measured readings
Содержание vLog 4.4
Страница 1: ...Veriteq vLog 4 4 User s Guide w w w v e r i t e q c o m w w w v a i s a l a c o m ...
Страница 6: ......
Страница 16: ...Introducing Veriteq vLog 10 ...
Страница 17: ...11 2 Installing vLog Software System Requirements 12 Installing vLog Software 12 ...
Страница 20: ...Installing vLog Software 14 ...
Страница 98: ...Viewing Reports and Statistics 92 ...
Страница 99: ...93 7 Troubleshooting Serial Port Problems 94 Frequently Asked Questions 95 ...
Страница 103: ...97 8 Glossary 98 A B 98 C E 98 F K 99 L Q 99 R T 99 U Z 101 ...
Страница 108: ...Glossary 102 ...