


•
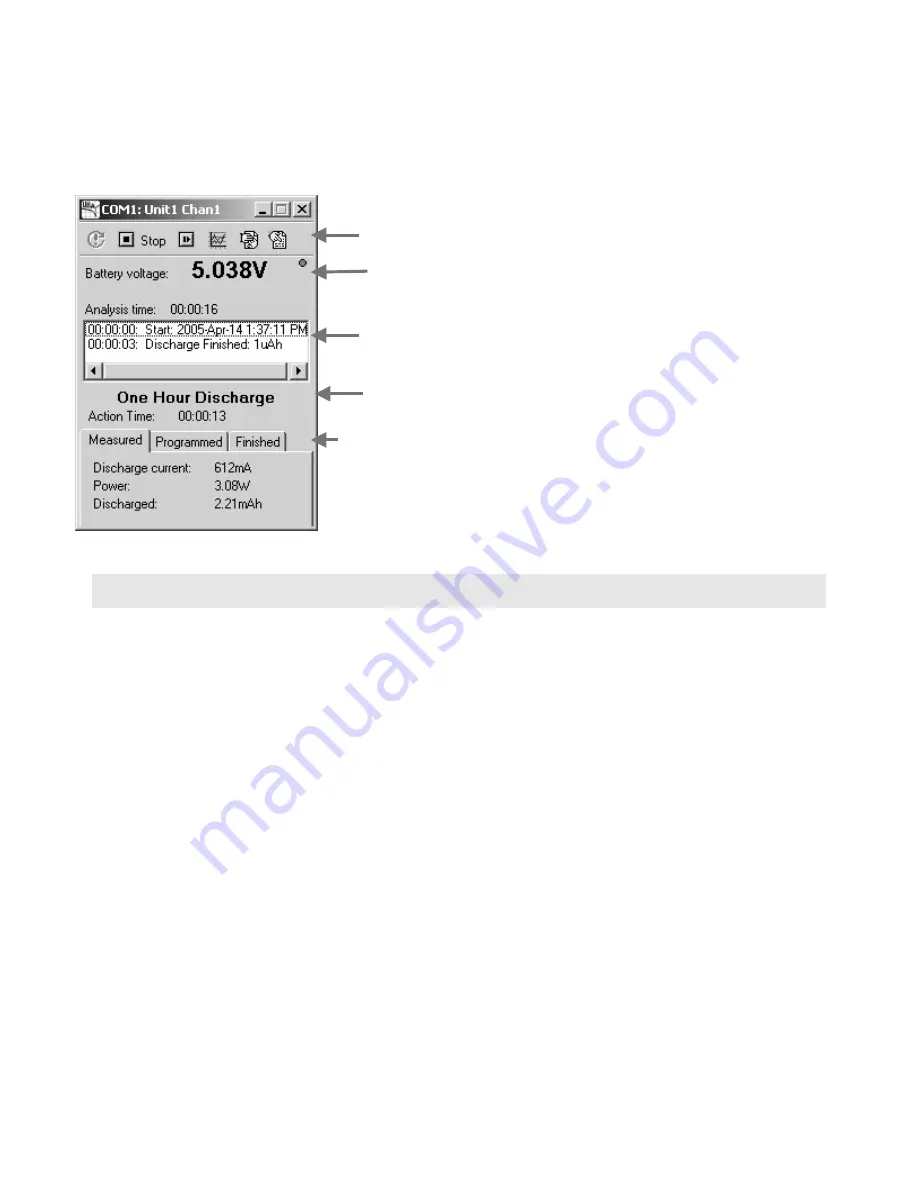
Show the results graph.
•
Hide this window (use Active Instruments on the Instruments menu to redisplay).
•
Show the starting parameters.
Right click on this battery analyzer window and select Grow (or Show More Information) for more information.
Figure 16: Battery Analysis window (after right clicking on it and selecting Grow).
Hint: hold your mouse cursor over the Discharged value for percentage discharged, double click on it to
change the displayed value to percentage. Double click again to switch back.
3.4. Monitoring the Battery Analysis
Note that in this example the battery analysis starts in discharge. This is the default behavior of most of the BARs that
come with UBA Console. When the battery voltage reaches the cut-off value (the voltage where the battery is
considered fully discharged) the load is shut off and the charging starts (sometimes after an optional rest).
Click the View Results icon on the tool bar to get a graphical view and summary of the progress so far.
The battery analysis is finished when either the word “Finished” appears or the battery is in trickle charge (assuming
that trickle charge is the last action in the BAR).
3.5. Interpreting the Results – Is My Battery Any Good?
When the analysis is over, press the View Results icon on the tool bar to get a graph of the battery voltage and the
test results. If you've closed the battery analysis window, you can view the results from Battery Analysis Results File
Viewer from the File menu.
The UBA Let's Get Started Guide
Page 11
Additional information available on these tabs:
Measured: various measured values.
Programmed: the “set to” values.
Finished: conditions for the current action to finish.
Tool bar
Battery voltage. Move the mouse cursor
over the voltage to get the per cell value.
Current action and the elapsed time.
Summary of events and test results.


