Manual – Starflow Ultrasonic Doppler Instrument
Model 6526
Unidata Manual - 6526 Starflow User Manual Issue 17 01 2020.docx
Page 38
•
Table
: This displays the logged data in tabular form.
•
Graph
: This display the logged data in a graphical form as a line plot of data.
Each logged item forms a series and each can be individually turned on and off.
8.4.1
Log Buffer Table View
This is the default Log Buffer view. Each column is a different logged data item. Each row is a log
record. To change to the Graph view, right-click anywhere over the table data and select
Graph
from the menu.
To change the number of log records shown, right-click anywhere over the table data and select
the required number of records from the
View
sub-menu. The data selected is always from the
most recently logged records. Since 100 records is the largest number available, data logged
more than 100 records ago cannot be viewed in Test Mode. You will have to unload the logger to
see older data.
8.4.2
Log Buffer Graph View
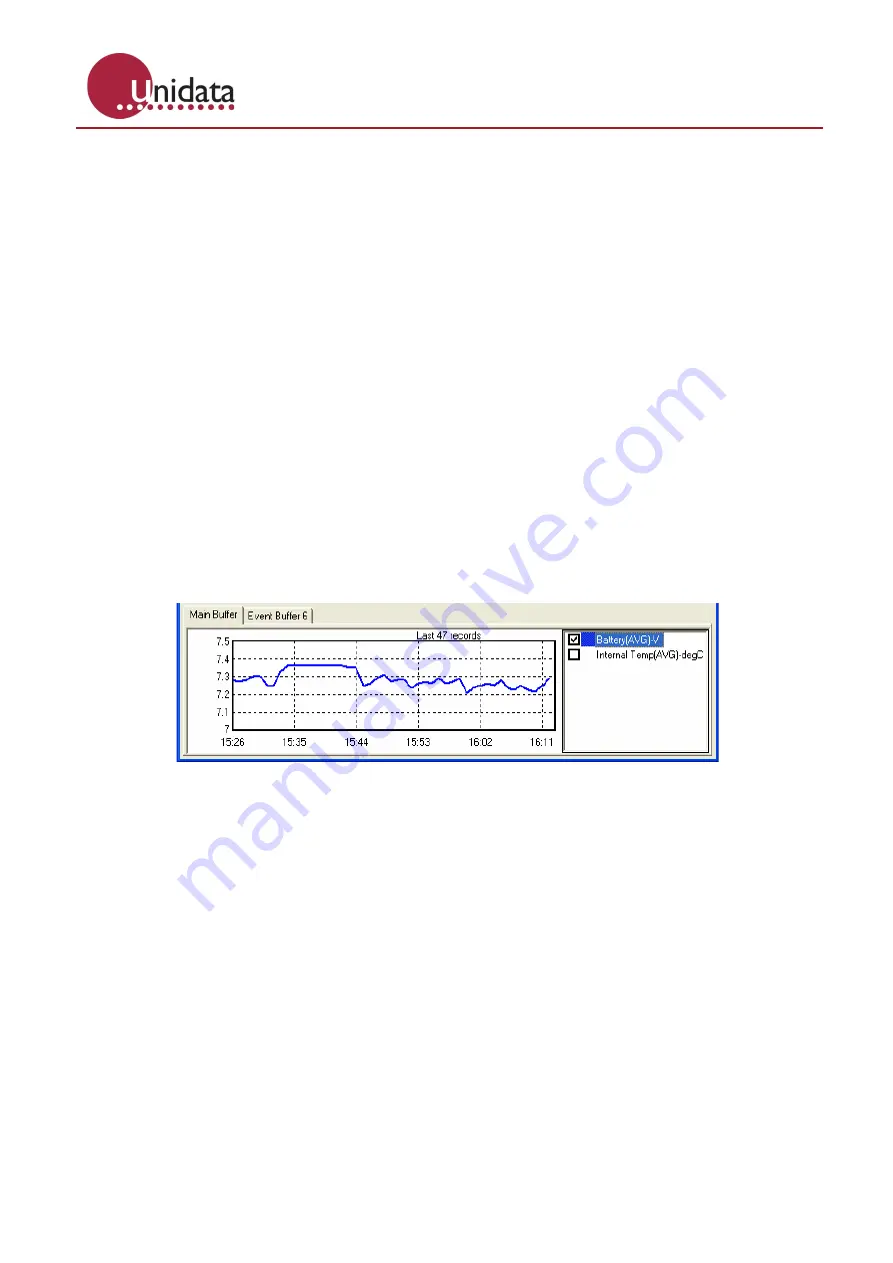
The Graph View displays the logged data in the form of a series line plot. Each logged item forms a
different series. The time of log is the X-axis, the Y-axis is the value of the logged items.
To change to the Table view, right-click anywhere
outside
the plot area (either of the axes or the
Last N records
title) and select
Table
from the menu.
To change the number of log records shown, right-click anywhere
outside
the plot area (either of
the axes or the
Last N records
title) and select the required number of records from the
View
sub-
menu. The data selected is always from the most recently logged records. Since 100 records is
the largest number available, data logged more than 100 records ago cannot be viewed in Test
Mode. You will have to unload the logger to see older data.
To adjust which data series are plotted, either use the checkboxes to the right of the plot area, or
right-click in the plot area and select/deselect the series from the
Filter
sub-menu.
To see the specific value at a point on the graph, move the mouse over the graph and line up the
vertical line that moves with the mouse pointer over the point of the graph that you’re interested in.
After a short delay a popup tooltip will appear showing the date/time and value of the data at that
position.
The following shows that at 08/02/2007 15:47:00 a value of 7.29 was logged:


