5.4.2
FFT Power Spectrum
5.4.3
Single FFT Statistics
S
N
P
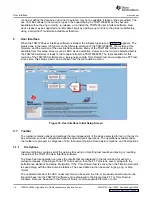
SNR = 10Log 10
P
(1)
S
N
P
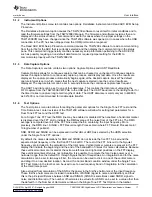
SINAD = 10Log 10
P
+
P
D
(2)
www.ti.com
User Interface
FFT calculation from presenting a
smeared
power spectrum due to the fact that the FFT presumes the
sample of the input is part of a continuous input signal. If the input and sampling frequency is not
coherent, and the sampled data is appended end to end to form a continuous input signal, then there is an
apparent phase discontinuity at the beginning and the end of the sampled data. Making the sampling and
input frequencies coherent avoids this apparent discontinuity. If the input frequency cannot be made
coherent, then the windowing functions other than Rectangular can be used to process out this effect to
some degree.
The FFT record length can be set in the FFT Record Length (NS) input text box. The TSW1200EVM
supports FFT record lengths of as much as 65536 samples, or as little as 4096 samples.
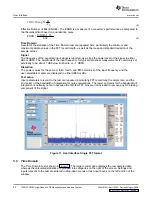
The FFT power spectrum of the captured data is displayed in the major center portion of the window. The
TSW1200 software automatically scales the horizontal axis from DC through the Nyquist frequency,
although the scale of the horizontal axis can be changed simply by highlighting the text and typing in a
new value. For example, the display in
can be used to zoom in on the input frequency by
highlighting the 0MHz and typing 25M, and then highlighting the 62.5M and typing in 35M. This causes the
portion of the power spectrum from 25 MHz through 35 MHz to fill the power spectrum display.
The vertical scale of the power spectrum is automatically scaled to display the noise floor of the FFT result
up through 0 dBFS. The vertical scale can also be manually adjusted by highlighting the limits of the
vertical scale and typing in new limits.
By default, the first few harmonics of the input frequency are marked in the display, as well as an
additional marker that can be placed by dragging the marker to any place in the power spectrum, such as
a noise spur that is not already marked as a harmonic. By default this additional marker initially goes to
the highest spur that is not identified as a harmonic.
Display properties can be edited by using the mouse to right-click in the power spectrum display. Visible
properties such as the graph palette or plot legend can be edited, and auto-scale of the vertical and
horizontal axises can be enabled or not.
For the Single FFT test, a number of calculated statistics and AC performance measurements are
displayed to the right of the power spectrum display, grouped into several categories.
AC
Signal-to-Noise Ratio – SNR is the ratio of the power of the fundamental (P
S
) or input frequency to the
noise floor power (P
N
), excluding the power at DC and the first five harmonics. SNR is either given in units
of dBc (dB to carrier) when the absolute power of the fundamental is used as the reference, or dBFS (dB
to full scale) when the power of the fundamental is extrapolated to the converter’s full-scale range.
Signal-to-Noise and Distortion (SINAD) – SINAD is the ratio of the power of the fundamental (P
S
) to the
power of all the other spectral components including noise (P
N
) and distortion (P
D
), but excluding DC.
Spurious-Free Dynamic Range (SFDR) – SFDR is ratio of the power of the fundamental to the highest
other spectral component (either spur or harmonic). SFDR is typically given in units of dBc (dB to carrier).
SFDR w/o 2,3 – Spurious-Free Dynamic Range without the second or third harmonic. Commonly the
largest spectral components after the fundamental are the second and third harmonics of the input
frequency, and commonly the input frequency can contain significant power in the second and third
harmonics. SFDR w/o 2,3 reports the SFDR with these two harmonics ignored.
Total Harmonic Distortion (THD) – THD is the ratio of the power of the fundamental (P
S
) to the power in
the first five harmonics (P
D
). THD is typically given in data sheets in units of dBc (dB to carrier).
SLAU212A – April 2007 – Revised August 2008
TSW1200EVM: High-Speed LVDS Deserializer and Analysis System
19

