Using Data & Statistics
107
Using Data & Statistics
The Data & Statistics application provides tools to:
•
visualize sets of data in different types of plots.
•
directly manipulate data sets to explore and visualize data
relationships. Data changes in one application are dynamically
applied to all linked applications.
•
explore central tendency and other statistical summary techniques.
•
fit functions to data.
•
create regression lines for scatter plots.
•
graph hypothesis tests and results (z- and t-tests) based on summary
statistics definitions or data.
Note
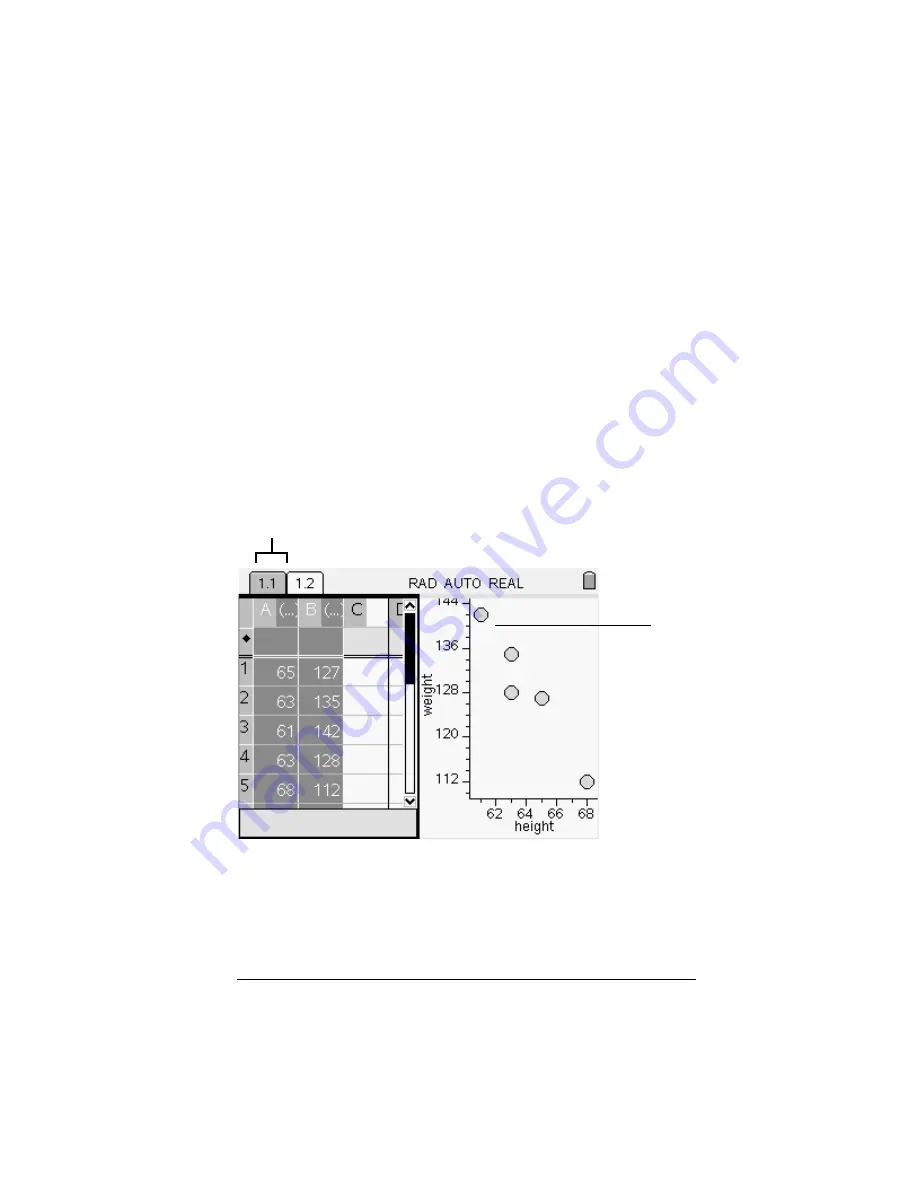
: In the following example, Lists & Spreadsheet is shown along with
Data & Statistics. This represents a typical page set-up.
À
Problem/Page number counter
Á
Sample Data & Statistics work area
Á
À
Содержание NS/CLM/1L1/B - NSpire Math And Science Handheld Graphing Calculator
Страница 1: ...Math and Science Learning Technology Handheld ...
Страница 8: ...viii ...
Страница 76: ...68 Using Calculator ...
Страница 100: ...92 Using Graphs Geometry ...
Страница 124: ...116 Using Data Statistics ...
Страница 132: ...124 Using Notes ...


