


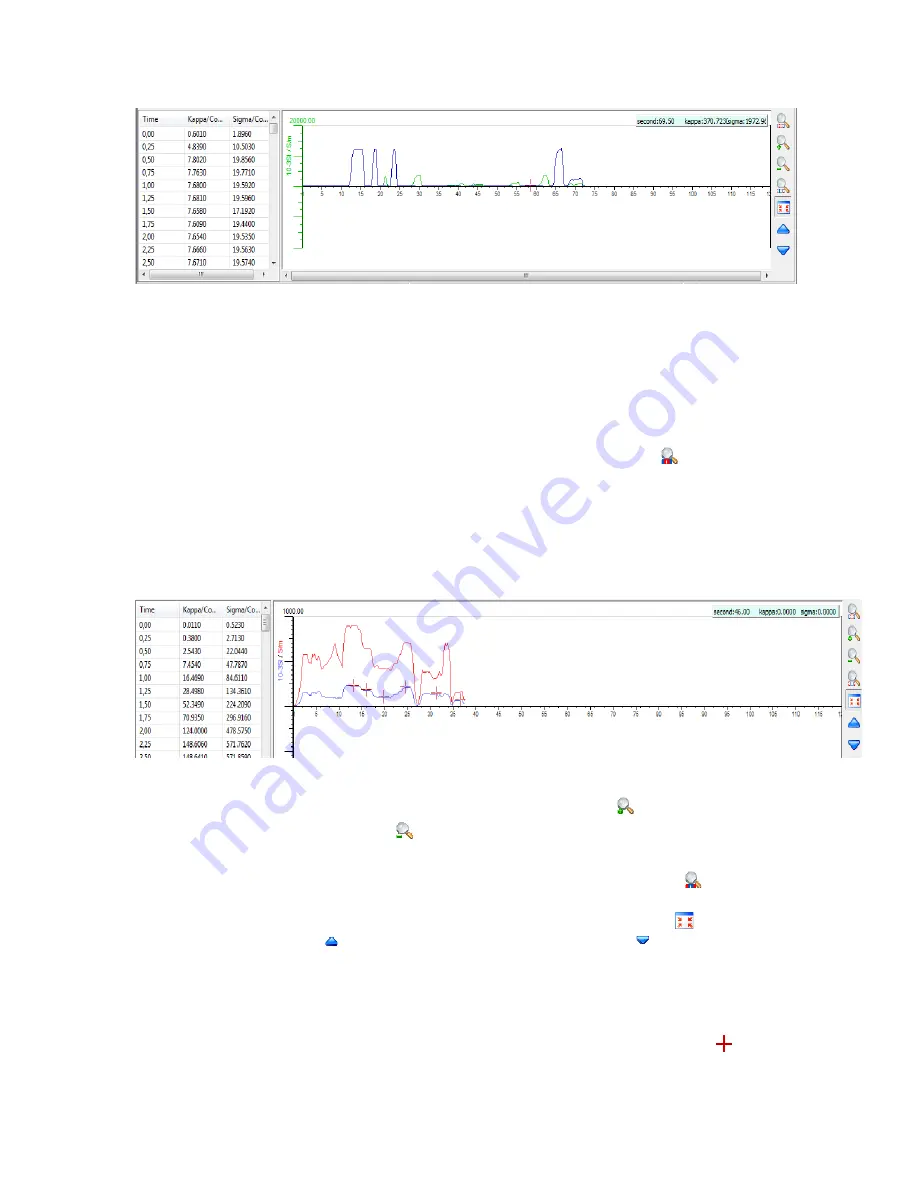
Figure 81: Scanner Data Plotted & Charted
To control the scanner graph use the icons to the right of the graph window, seen in
Figure 81
and
82
. There are four zoom function buttons, and three scale buttons.
The first of the zoom buttons, which is located at the top of the graph control pane, is
used to zoom on a selected section. To use this feature click on the icon then navigate
your mouse pointer to the section of the graph you wish to zoom in on, left click and hold
the button down while dragging the mouse to the end of the section you wish to zoom to.
When you release the mouse button the section highlighted will be seen as the entire
graph plot. An example of this can be seen below in
Figure 82.
Figure 82: Zooming on Scanner Graph
The next two buttons are for zooming in and out. Left click on the button to increase
the zoom level and left click on the button to decrease the zoom level.
To reset the zoom level to default and look at the entire scan record, use the button.
To apply an auto-scale to the plot, which is the default view, use the button. To
increase the scale use the button and to decrease the scale use the button.
Markers entered while scanning samples are presented in the plotted data and are visible
in the numerical data as well. The numbers that are in red are denoted as a marker and in
the plotted data the graphical representation of the marker is seen here as a cross .
74


