CTD-ES and CTD-ER Technical Manual
page 36
EAR-Controlled Technology Subject to Restrictions Contained on the Cover Page.
Opening the Coordinates Window in the Cast Graphics
Display
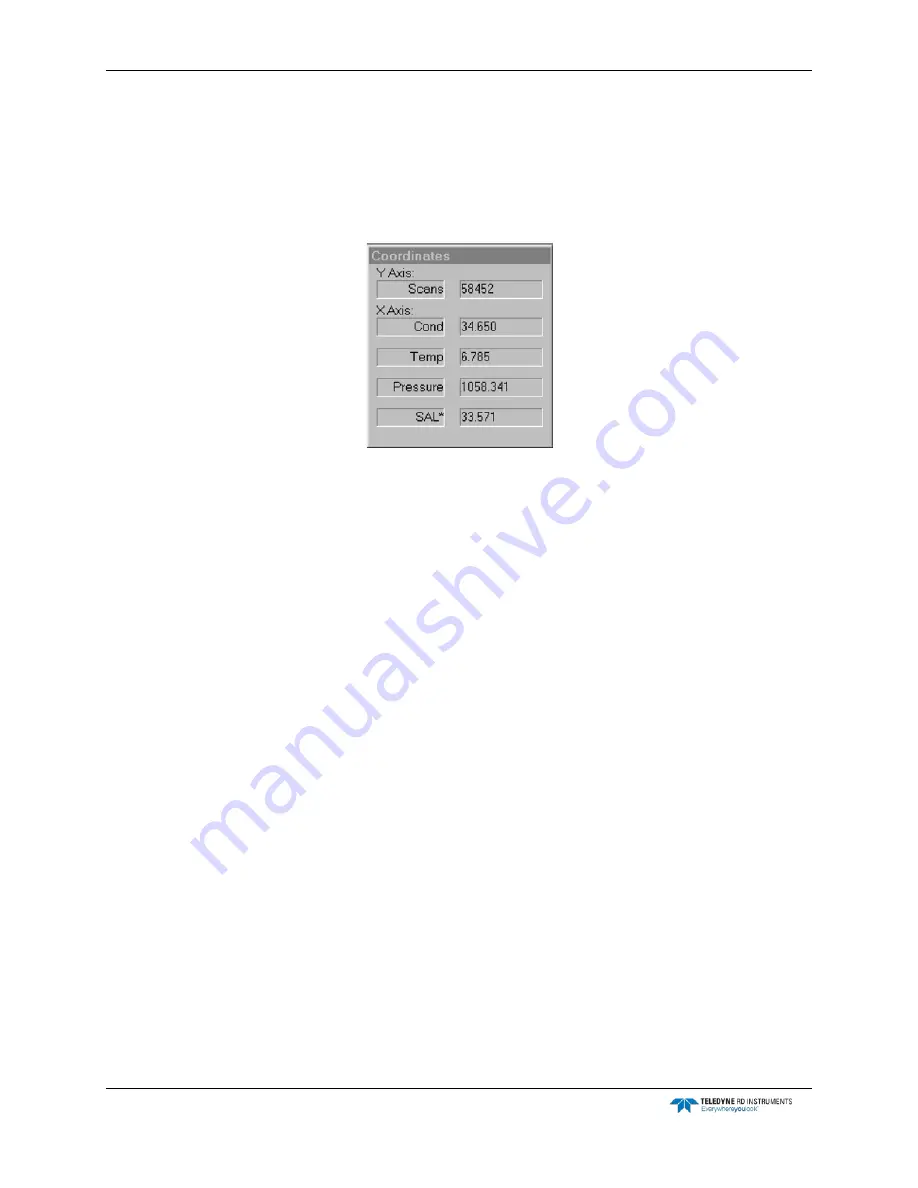
The Coordinates window, which is shown in Figure 18, displays the cast graph coordinates at
which the mouse pointer is pointing. As the mouse pointer is moved around the cast graph, the
displayed coordinates change accordingly.
Figure 18.
The Coordinates Window
To open the Coordinates window choose Display
➤
Show Graph Coordinates. To close the win-
dow choose Display
➤
Show Graph Coordinates again.
The Coordinates window can be moved anywhere on the screen. In Figure 17 the window is
shown in the lower left corner. To move the Coordinates window, place the mouse pointer on
the window’s title bar and press and hold the left mouse button while using the mouse to drag
the window to the desired location, and then release the mouse button.
Setting up the Graphs in the Towed Acquisition Graphics
Display
1. Choose File
➤
Tow Acquisition.
The TRDI Acquisition window opens. If this is the first time the window is opened, it ap-
pears as shown in Figure 14 with four pressure
graphs.
Any graphs that do not appear will be opened in the steps that follow.
2. Choose Display
➤
Pressure Graphs
➤
Pressure Graph 1.
The Pressure Graph 1 Setup dialog box shown in Figure 19 opens.


