2-24
Using the SunEye
View the Skyline Measurement Data
N O T E
The obstruction elevation view may show spikes or unusual results. Check that there are no
obstruction (green) artifacts and if so you can remove them in edit mode (from the annual sunpath
view).
Figure
2-41.
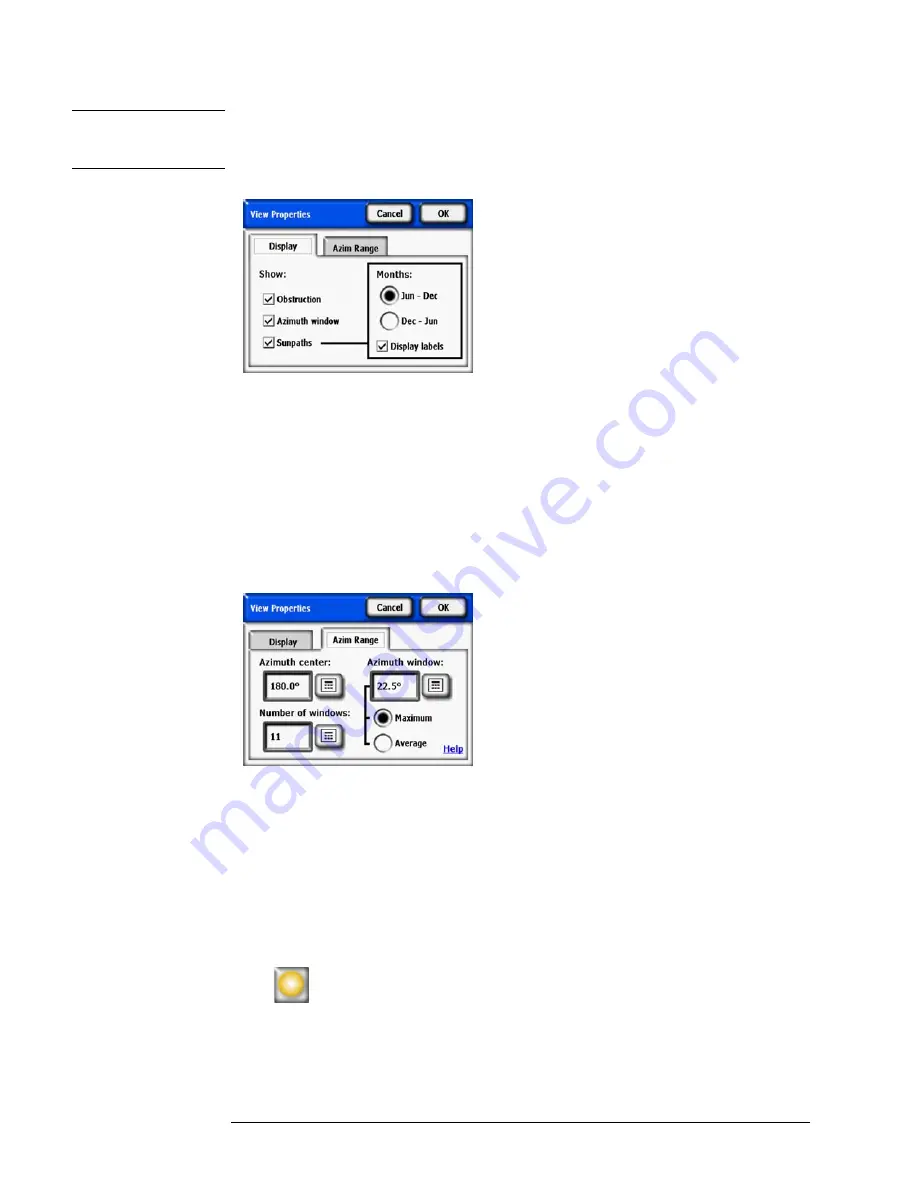
View Properties
In the Display tab, select what data will be displayed on the graph:
• Obstruction is the elevation data with one degree resolution
• Azimuth window is the overlaid bar graph of azimuth values for which the maximum (or av-
erage) data will be displayed
• Sunpaths
Also select which month label will be displayed on the sunpaths, Jun-Dec or Dec-Jun.
Figure
2-42.
Azimuth Range
In the
Azim Range
tab, select the
Azimuth center
, in degrees, for example, 180 for south, This
value is the center of the x-axis in the graph. Next, select the
Number of windows
that will be
displayed and the
Azimuth window
size in degrees. Note that there must be an odd number of
Azimuth windows, since there is one center window centered around the Azimuth center, and an
equal number of Azimuth windows on each side of that center window. The Start and Stop azi-
muth values will be automatically computed from the above values. Lastly, select whether the
Maximum
or
Average
elevation value will be displayed for each Azimuth window. Press
OK
,
and the graph will be modified with the new settings.
Select
>
View
>
Obstruction Elevation
>
Elevation Table
to show a table of the speci-
fied Elevation values in the Azimuth windows. An example, is shown below. Select
OK
to
return to the graph.
Содержание SunEye 210
Страница 1: ...Solmetric SunEye 210 User s Guide Solar Test and Measurement Equipment...
Страница 2: ...2 YOUR SK D dZ DISTRIBUTOR SOLIGENT 800 967 6917 www soligent net...
Страница 4: ...4...
Страница 16: ...1 10 Getting Started System Controls and Settings...
Страница 80: ...4 6 Solar Access and Interpretation of Data Numerical Calculations...
Страница 90: ...5 10 Maintenance and Troubleshooting Regulatory Compliance...


