


Remote Radio Link User Guide
Page 44
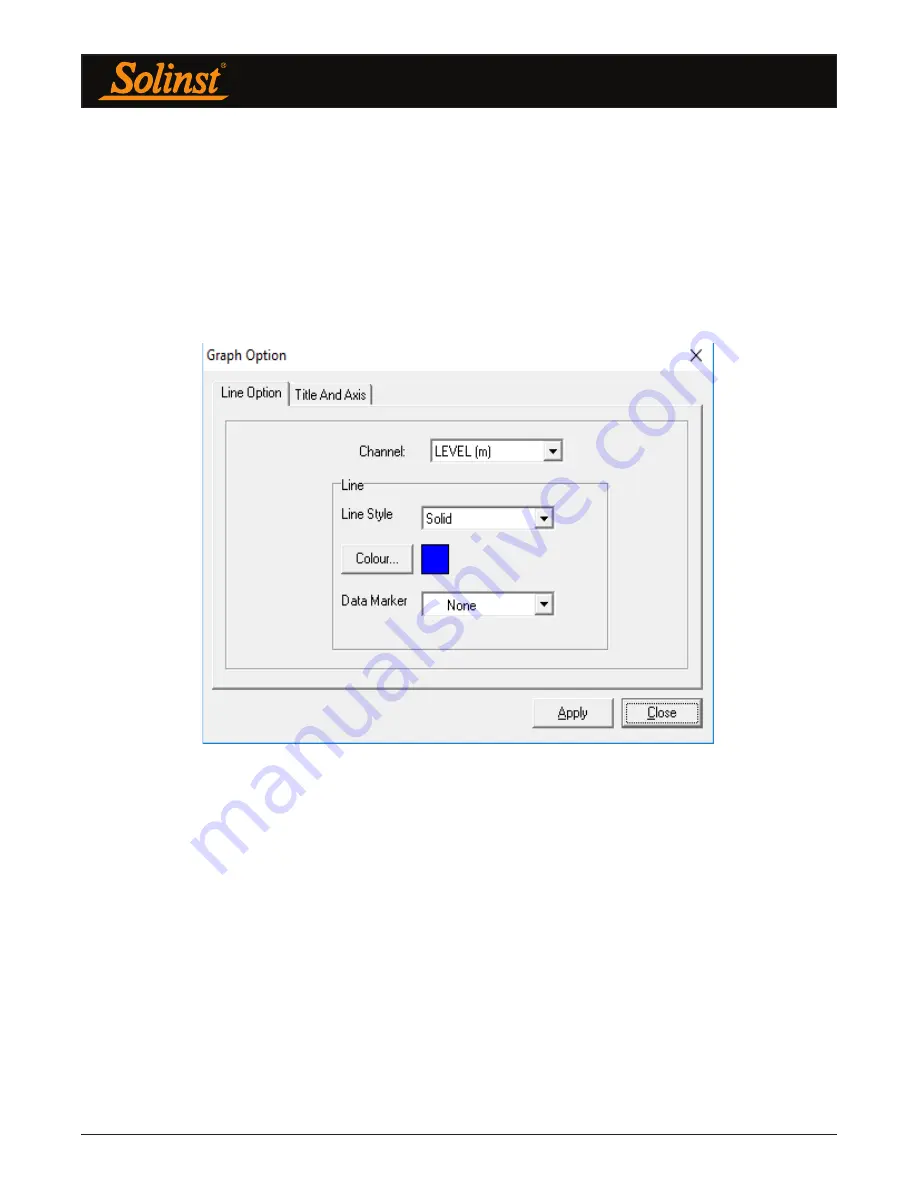
7.2.2 Graphing Options
Click the Graph Option icon to open the Graph Option Dialog. The Graph Dialog is shown in Figure 7-8.
The
Line Option
is used to adjust the style and colour of the line in the graph for each channel. The user can
also select the shape of the data marker or remove the data marker.
The
Title and Axis
Option is used to enter the title of the graph and change the Y axis label or user selected
scale. Check the Best Fit box to enable the software to determine the best fit scale. If the Best Fit box is not
checked, the user has to enter a maximum and minimum value of the selected channel. The X axis is logging
time.
Figure 7-5 Graph Option Dialog Box
Содержание Remote Radio Link
Страница 1: ...Solinst Remote Radio Link RRL User Guide November 6 2018...
Страница 51: ......