


Chapter
6
Operating Instructions
CLV 490 Bar Code Scanner
6-48
©
SICK AG · Division Auto Ident · Germany · All rights reserved
8 009 993/O824/20-12-2004
Operation
Proceed as follows to check the restricted evaluation range:
1.
Click
in the toolbar.
The Terminal Emulator window is then displayed. The CLV is in the Reading mode.
2.
In the D
EVICE
MODE
section, choose S
HOW
CP-
LIMITS
.
The dialog box for the distance configuration is then displayed.
3.
Click the distance configuration for which the active evaluation range of the scan line
has been restricted (DC-specific). The "Device Ready" LED is extinguished. The CLV
cancels the Reading mode and blanks the red scan line alternately (as described
above) as of CP
min
and CP
max
.
4.
Check
Step 2 and 3
for each active distance configuration to determine whether the
bar code is in the center of the range between the end of the shorter scan line (CP
min
)
and the end of the longer scan line (CP
max
) or, if there are several bar codes, to
determine whether the center of the field of all the codes is within the range.
5.
If necessary, correct CP
min
and CP
max
accordingly. Perform a download to the CLV!
6.
Choose R
EADING
M
ODE
to exit the Show CP-limits mode. The CLV returns to the Reading
mode and the ”Device Ready” LED lights up.
Note
In the Reading mode, the CLV does not actually blank the scan line visually, but instead takes
the values specified for the restricted evaluation range into account when the data contents
are decoded.
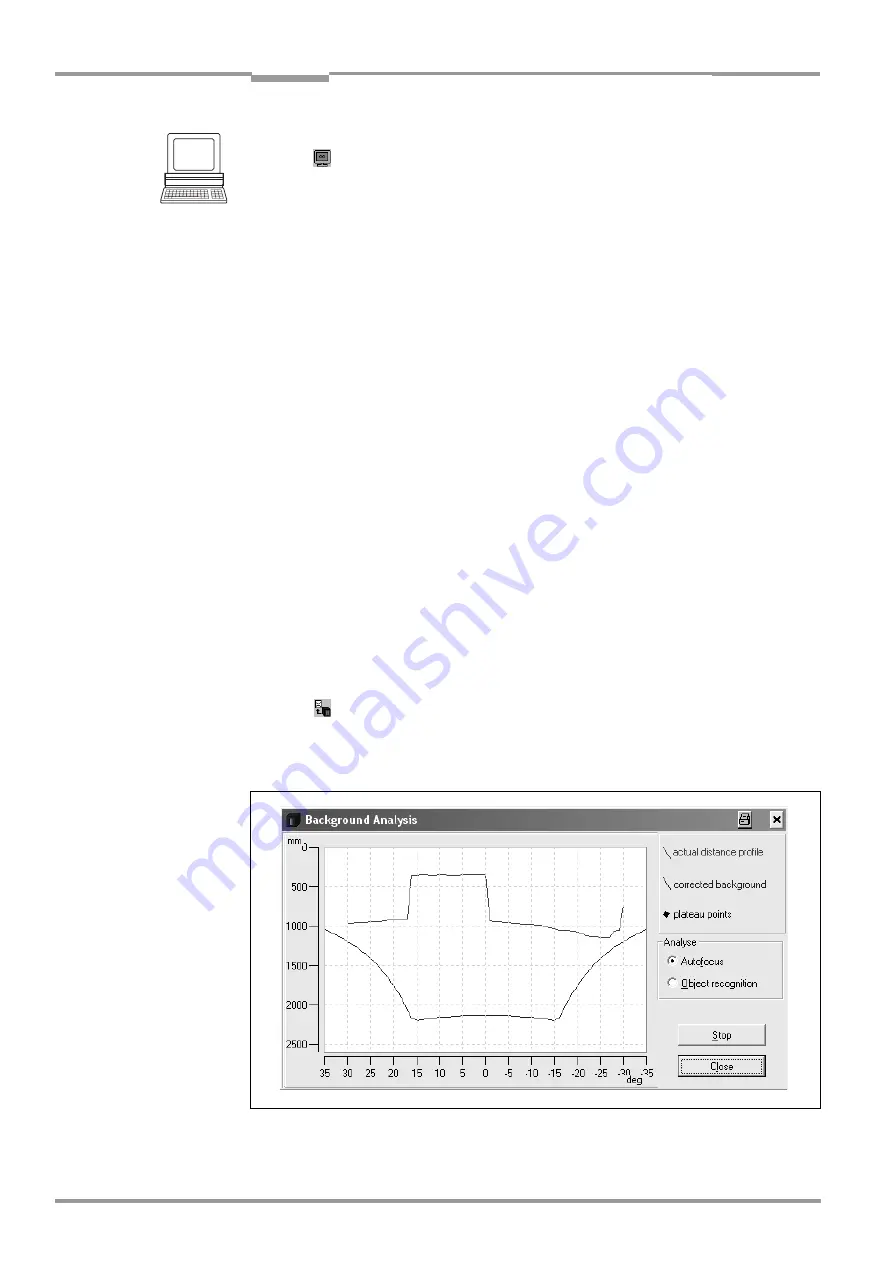
6.5.6
Background Analysis
In this mode, CLV-Setup shows online how the CLV interprets the distance measurement of
its visual range. This function provides information on the gradient of the current detected
background (current distance profile), the background which was corrected via
parameterizing/Background Teach-in and the points in the distance profile focused on by
the CLV. The distance measurement must be activated for this (default setting).
¾
Click
or choose CLV 490, B
ACKGROUND
A
NALYSIS
in the menu bar.
The B
ACKGROUND
A
NALYSIS
dialog box is displayed and shows the values in the plot
diagram. The red line shows the current distance profile, the blue line shows the
corrected background.
Fig. 6-14:
CLV-Setup: Example of output in the "Background Analysis" dialog box


