XFp Extracellular Flux Analyzer User Manual
_____________________________________________________________________________________________________________________
5.
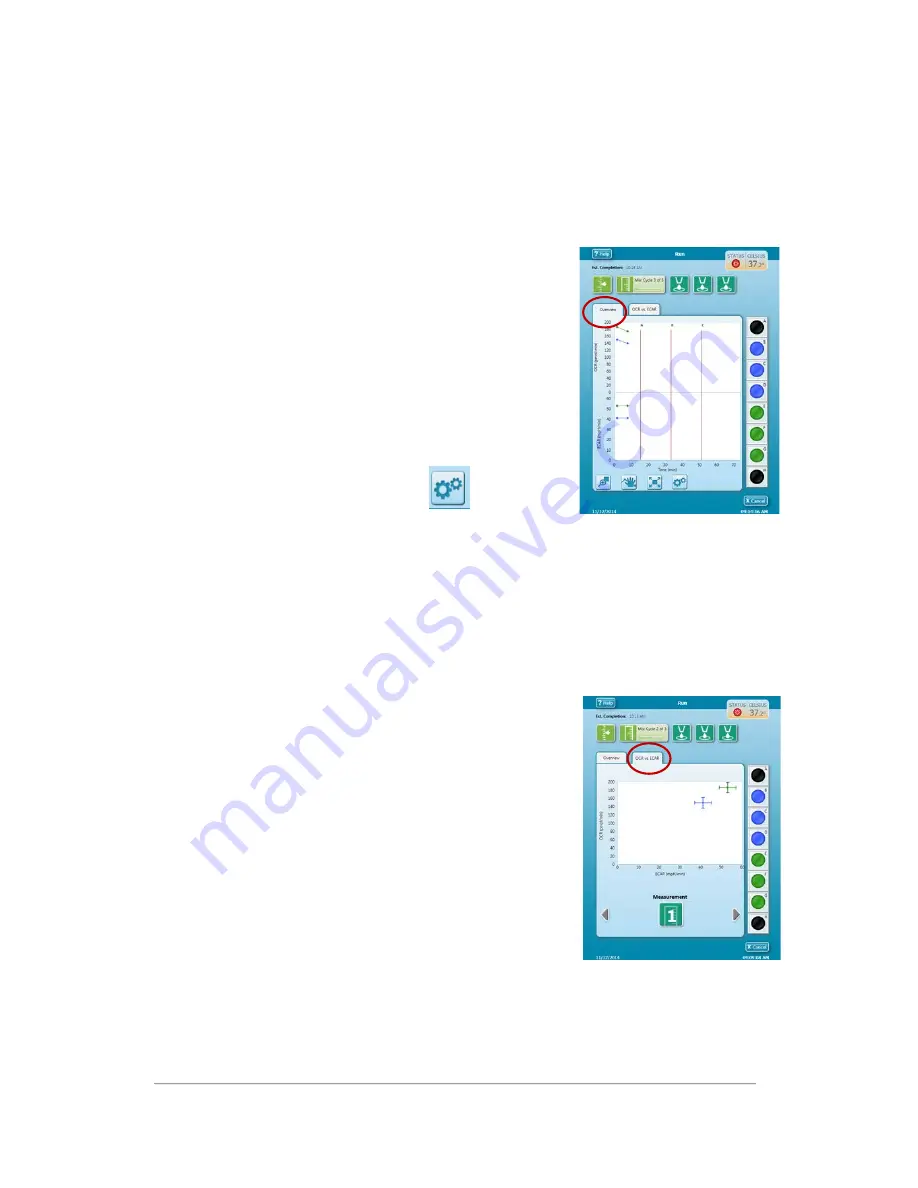
During the assay, two views are automatically available to visualize the data being acquired by
the XFp Analyzer. Select either tab to toggle between the views.
a.
Overview
The overview tab displays both OCR and ECAR as a
function of time.
Red vertical lines indicate the injections and are
labeled by injection port letter.
i.
In this view the charts can be zoomed and
scaled by choosing one of the tools below the
charts:
1.
Zoom
2.
Move
3.
Reset
ii.
By default, Rate data is displayed in Group
mode. By touching
the Options button,
different data can be
displayed:
1.
Show StdDev
turns on display of error bars for the each Group.
2.
Level Data
shows the concentration data from which the rate data is
derived.
3.
Well Mode
shows the data from the individual wells instead of the
average of the wells in each group.
b.
OCR vs. ECAR
The OCR vs. ECAR tab displays OCR on the Y-axis and
ECAR on the X-axis. Choose a single time point at
which to examine OCR vs. ECAR by using the
Measurement selector below the chart. Data are
displayed in Group Mode with standard deviations.
The scale of this chart is fixed to allow easy
comparison of values across measurements.
Note:
In both the Overview and OCR vs. ECAR views, the display of
individual wells can be turned off by touching the well graphic on the
right. Background correction is always performed while the
experiment is running.
12


