49
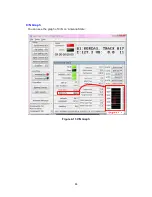
Graph
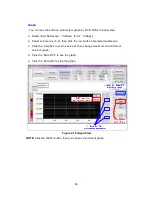
You can see the antenna parameters graph by SCS. Refer to below step.
a. Select item(‘Reference’, ‘CurSate’, ‘Error’, ‘Voltage’),
b. Select sub menus (1~9), then click the ‘on’ button of selected submenus.
c. Click the “Axis Set’ to set the axis set, then change maximum and minimum
value of graph.
d. Click the ‘Data OFF’ to see the graph.
e. Click the ‘Data ON’ to stop the graph.
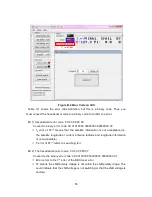
Figure 4-18 Graph View
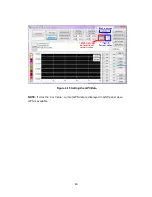
NOTE: Click the ‘HELP’ button, then you can see the index of graph.
Содержание SUPERTRACK SDA-390
Страница 7: ...3 Figure 2 2 Best Location II Figure 2 3 Antenna Blockages...
Страница 11: ...7 Figure 2 7 Tighten the nuts from below...
Страница 22: ...18 Figure 3 2 Antenna Control Unit Front Panel Figure 3 3 Antenna Control Unit Back Panel...
Страница 36: ...32 Connection Staus Display of LCD Figure 4 2 Connection Status SDA 390 with PC...
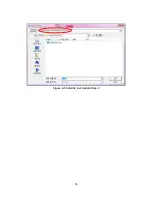
Страница 39: ...35 Figure 4 5 Satellite List Update Step 2...
Страница 48: ...44 C N Graph You can see the graph of C N on Antenna State Figure 4 13 C N Graph...
Страница 55: ...51...
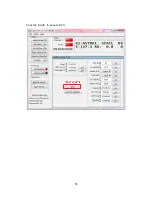
Страница 57: ...53 Click the SAVE to save to PCU...
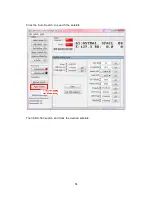
Страница 58: ...54 Click the Auto Search to search the satellite Then SDA 390 search and track the desired satellite...
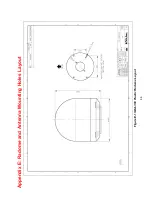
Страница 68: ...64 Appendix E Radome and Antenna Mounting Holes Layout Figure E 1 SDA 390 Plastic Radome Layout...

