


21
Flow cytometry analysis of dPCR droplets
5.
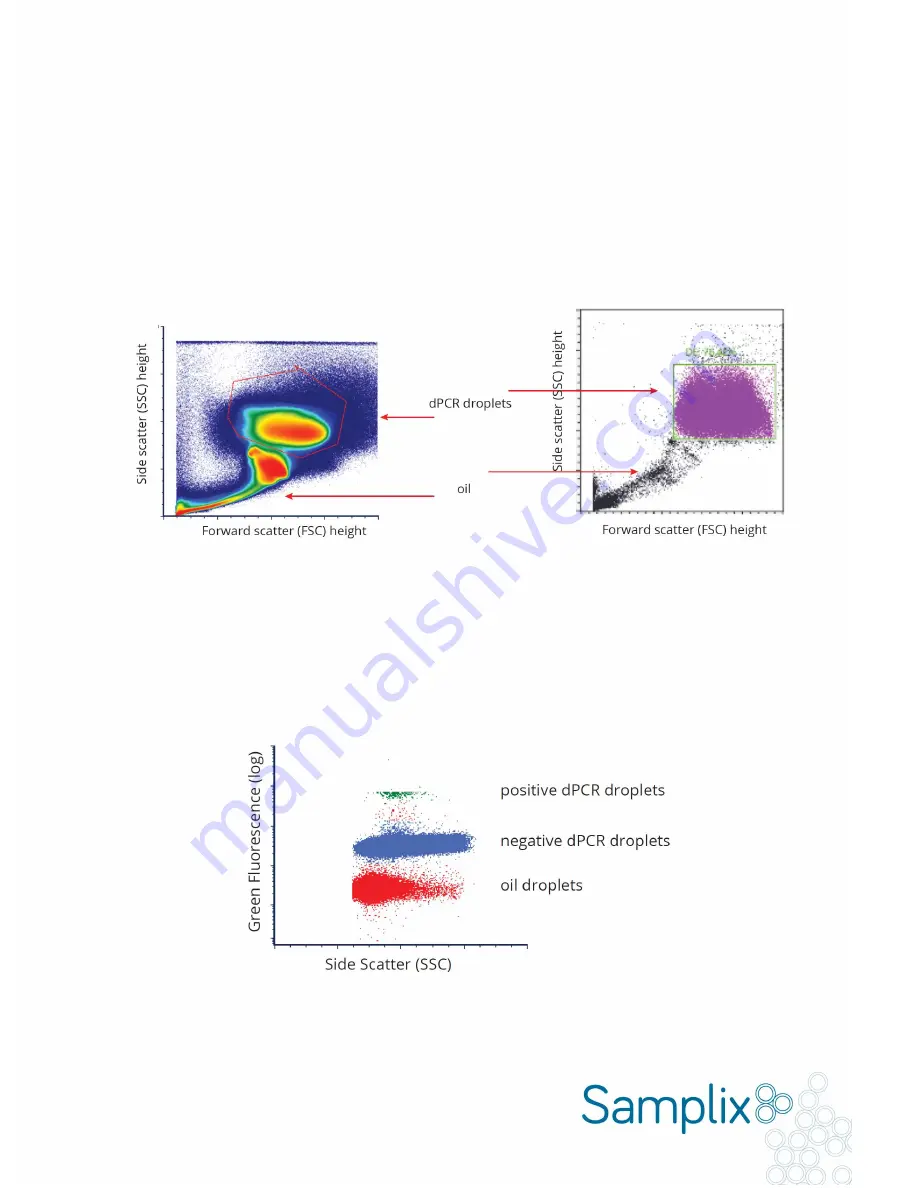
Identify the dPCR droplet population on a plot of FSC (height) versus SSC (height) (Fig. 4.1). dPCR droplets are
higher in side scatter (SSC) than oil droplets. Note that it could take a few minutes before the heavy dPCR
droplets are analyzed and visible in the plot.
Fig. 4.1
.
Identify dPCR droplets on a plot showing forward scatter (FSC) versus side scatter (SSC) or back scatter (BSC). The “height”
setting more clearly shows the population of correct droplets. Same data on two different instruments. Left: Density view of all events
from a flow cytometry software (FCS Express 6). Right: Dot plot showing dPCR droplets inside the green gate. (SONY SH800 Cell sorter,
software SONY).
6.
Gating the identified dPCR droplets in a new plot, identify a positive and a negative green fluorescent
population of droplets. Using a green filter, the positive fluorescent population can be excited with a 488 nm
laser and detected in the green channel (Fig. 4.2). Plot fluorescence versus side scatter (SSC).
Fig. 4.2
.
Identify positive fluorescent population versus side scatter. The positive population is green, the
negative population blue and the oil droplets red in this figure.