


11
Primer optimization
The design and location of the primers used must be optimal for the assay. Optimize the dPCR reaction preferably by
qPCR using your sample DNA as a template. Include a negative control with no template and at least three different
concentrations of your template in the range of the amount of input DNA for the dPCR assay suggested by the online
sample calculation tool at
samplix.com
.
It is advised to run a melting curve analysis with the template DNA, dPCR primers designed and Samplix reagents to
check for the presence of alternative amplicons and primer-dimers. Consider running a temperature gradient to
determine the best annealing temperature.
Use the Samplix primer test PCR kit (Cat. No. RE10200) with Samplix dPCR mix (2X)
●
and Samplix qPCR dye
●
to verify
the primers and reaction efficiency.
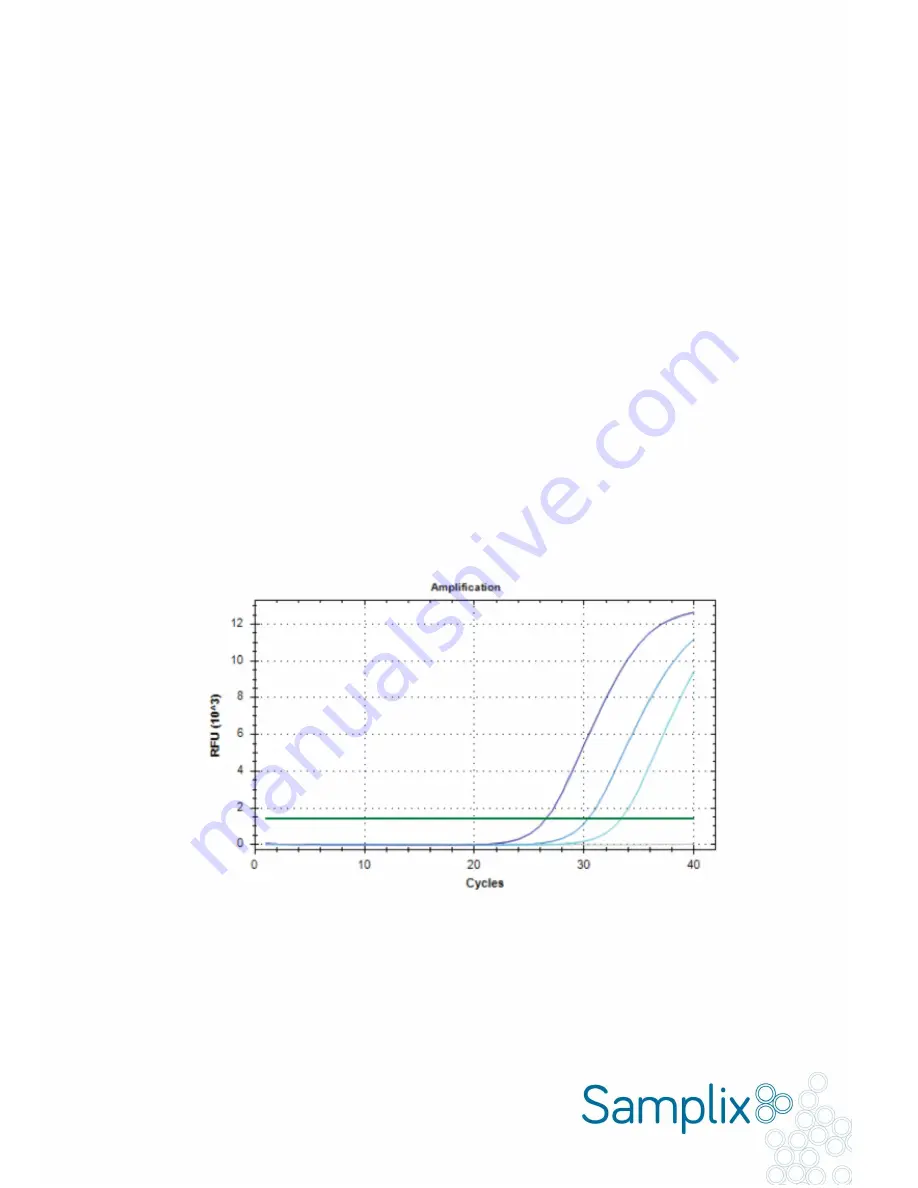
To calculate the PCR efficiency, run a qPCR with a standard curve with at least three different amounts of input DNA
using the Samplix dPCR mix and your designed primer pairs (Fig. 2.1).
Calculate the PCR efficiency using the Ct values as input with the formula:
(10^(-1/slope)-1) *100
Make sure that your designed primer pairs have an efficiency between 90-110 %.
Fig. 2.1.
Standard curve of the number of cycles versus fluorescent signal with three different amounts of input DNA for
calculation of PCR efficiency. To determine the PCR efficiency of the dPCR reaction, run a qPCR reaction using Samplix
dPCR mix (2X)
●
and your designed primer pair with increasing amounts of input DNA.