Peak Performance in Spatial Multiplexing Mode
R&S
®
AMS32-K31
31
User Manual 1175.6678.02 ─ 01
The lower the downlink level is at which a certain CCDF value is reached, the better
is the UE’s MIMO performance.
●
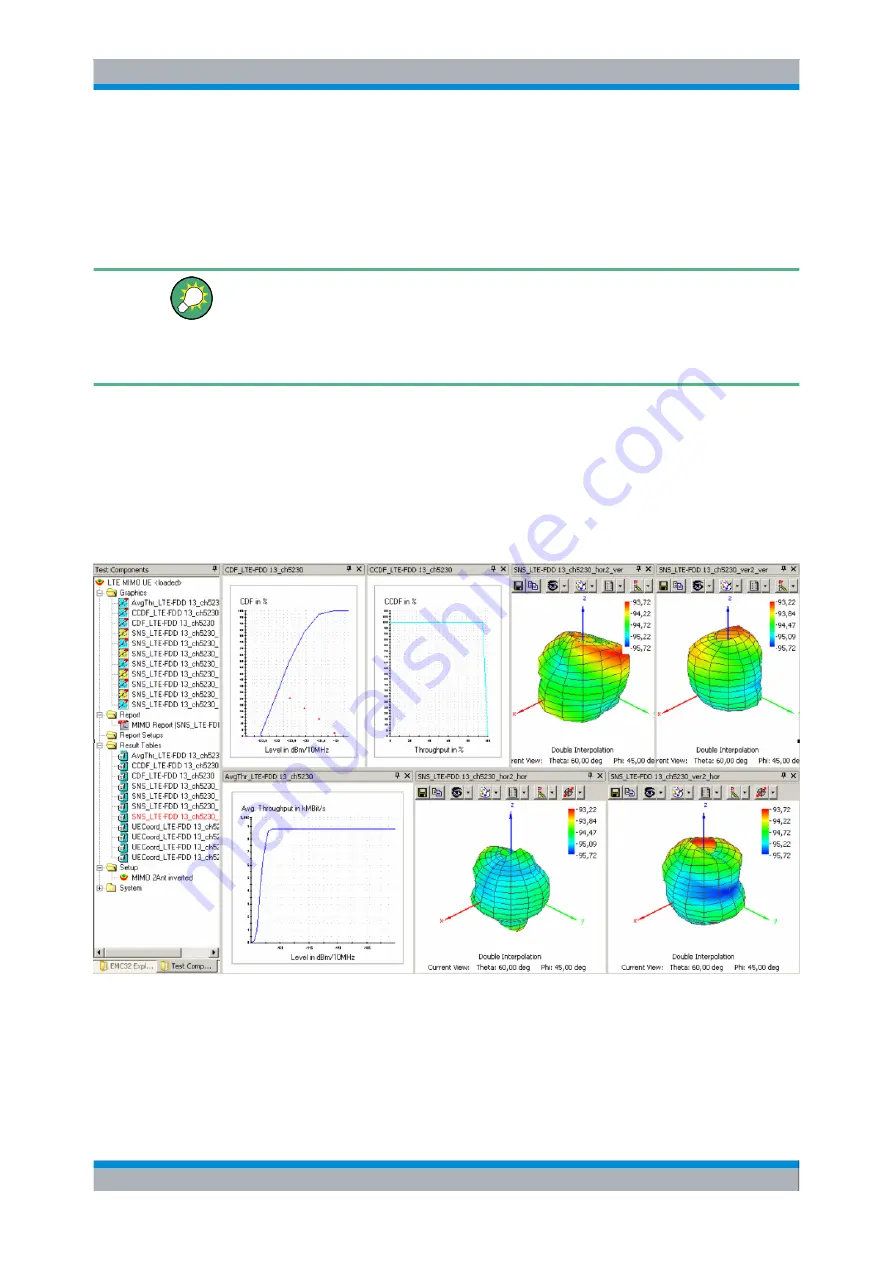
The "MIMO Report" contains the result tables, the CDF graph, the average through-
put and CCDF graphs, and all 3D graphs. A separate report file is generated for each
RF channel.
Normalization of downlink levels and sensitivity threshold levels
The levels in the CDF, Avg. Throughput, and CCDF graphs and tables are either refer-
enced to the subcarrier spacing (dBm/15 kHz values) or to the full cell bandwidth (dBm/
10 MHz values). You can switch the scale as described in
chapter 2.3, "Result Evaluation
In addition to the sensitivity thresholds measured at each point, which are saved to the
result table of the test, R&S AMS32 logs the BLER and throughput values measured at
every downlink level during the test. The data are logged to a file
LteMimoData.csv
in
the test’s
\System
sub-folder. The layout of this
*.csv
file is analogous to the single-
The example below shows a complete test result for a dual-antenna measurement for a
single RF channel and four polarization combinations.
Result Evaluation and Reporting


