


Diagnostics
Page 51 of 69
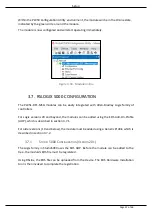
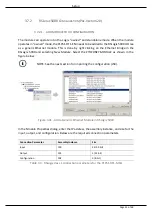
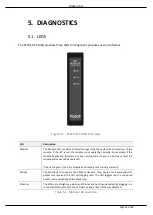
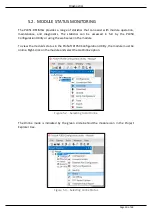
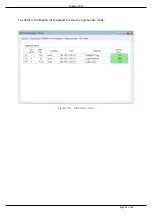
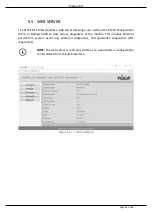
The Status monitoring window can be opened by either double-clicking on the Status item in
the Project Explorer tree, or by right-clicking on the module and selecting Status.
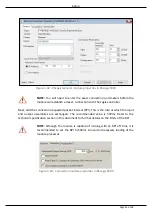
Figure 5.4. - Status monitoring - General
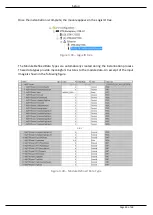
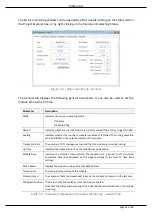
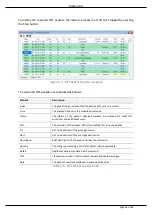
The General tab displays the following general parameters. It can also be used to set the
module time to the PC time:
Parameter
Description
Mode
Indicates the current operating mode :
DF1 Slave
Scheduled Tag
Owned
Indicates whether or not the module is currently owned (Class 1) by a Logix controller.
Routing
Indicates whether the routing of module is enabled or inhibited. The routing operation
can be inhibited in the output assembly of the module.
Transaction Rate
The number of DF1 messages per second that the module is currently routing.
Up Time
Indicates the elapsed time since the module was powered-up.
Module Time
Indicates the module’s internal time. The module time is stored in UTC (Universal
Coordinate Time) but displayed on this page according to the local PC Time Zone
settings.
MAC Address
Displays the module’s unique Ethernet MAC address.
Temperature
The internal temperature of the module.
Processor Scan
The amount of time (microseconds) taken by the module’s processor in the last scan.
DIP Switch Position The status of the DIP switches when the module booted.
Note that this status will not change if the DIP switches are altered when the module
is running.
Table 5.2 - Parameters displayed in the Status Monitoring – General Tab
Содержание PLX51-DF1-MSG
Страница 1: ...PLX51 DF1 MSG DF1 Messenger DF1 to EtherNet IPTM Messenger December 2017 USER MANUAL...
Страница 4: ...Page 4 of 69...
Страница 10: ...Page 10 of 69...
Страница 48: ...Operation Page 48 of 69...
Страница 60: ...Page 60 of 69...
Страница 64: ...Page 64 of 69...
Страница 68: ...Page 68 of 69...