Go to cover page
202P7 CRT
7
Electrical Instructions
adjustment for Smart mode color once it finished the 6500
°
K
from 7.2.1 to 7.5.2 .CAA re-adjusts the 5500
°
K & 9300
°
K
then adjusts 4000
°
K, 4600
°
K and 8000
°
K, figures out the
necessary 2 groups (one for G-gain, one for B-gain) of 1
constant and 3 coefficients data by these adjustments and
writes it into EEprom via MCU of the monitor under tested,
the address A0 page 0xF0 to 0xF7 store the G-gain data,
0xF8 to 0xFF store the B-gain data. The MCU of monitor will
perform the SmartMode color by these data.
8.
Adjustment of the picture geometry
8.1
EEprom data has to be preset data according to software
approval sheet.Sheet 139, sheet 140. Pre-set data please
refer: TIMING TABLE 1 to 36
Note: The EEprom should be loaded beforehand with average
values of mode preset data and mode preset selection bytes.
This preload data should be collected by EPE from product
batch by batch to keep the entire image of all preload modes
display inside the bezel with the a specification of H-width:
392mm
±
10 mm and V-size: 294mm
±
10mm.
8.1.1
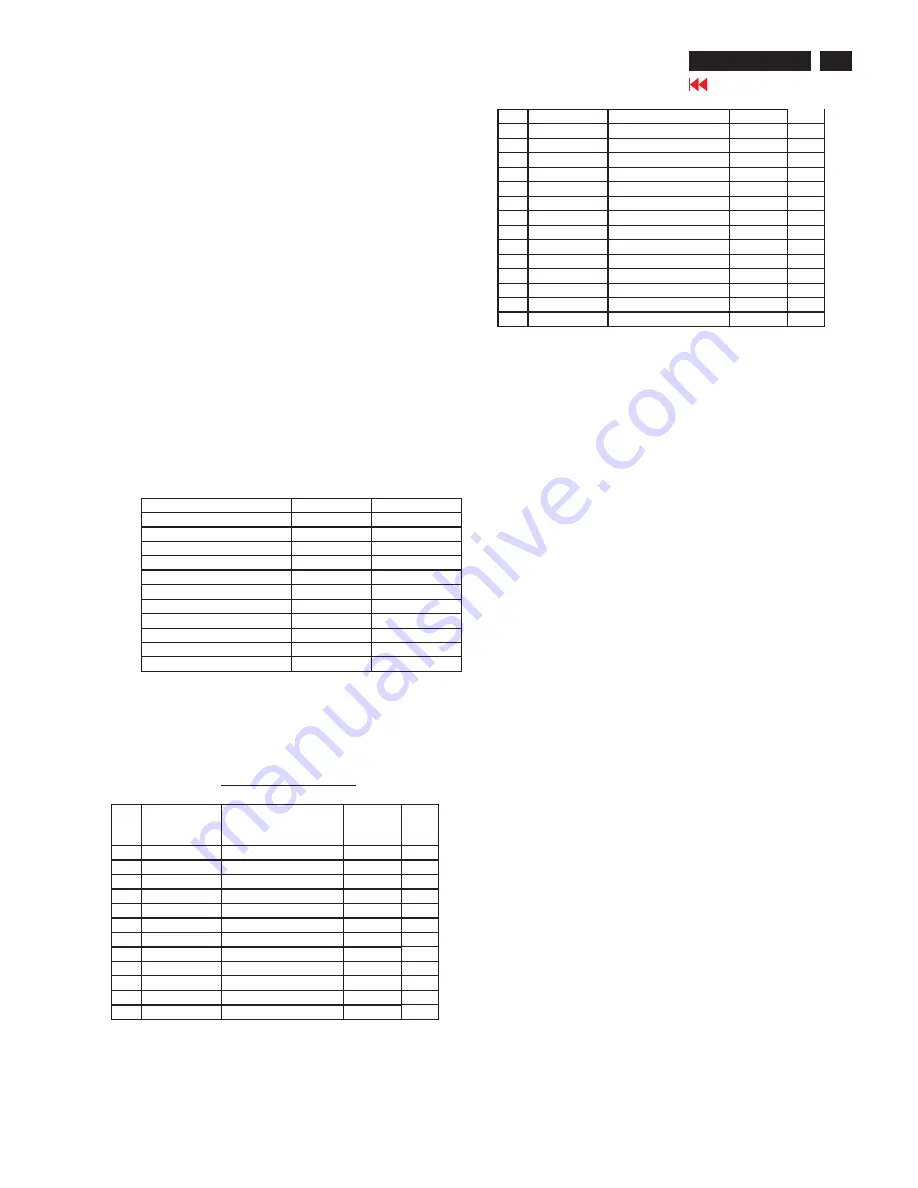
Preload the default DAC value into following listed items-
Item
DAC Value
Remark
FOCUS H / V
0 / 200
Default
VLINBAL
85
Default
USER H-Range
64
Specified
RASTER H / V
160 / NU
Default
LIN H / V
* / 223
Default
SUB
Å
(ZOOM -Range)
64
Specified
V OFFSET / GAIN
150 / 200
Specified
D convergence
0
Default
NS Purity
127
Specified
CORNER TOP/BOTTOM
105 / 95
Default
BAIS LIMIT
153
Specified
Remark: Default - EPE has to correct these values batch by
batch to achieve best product FOS.
Specified - These values should be kept no change for the
production, Dev has the Responsibility to check and modify
with the proper values.
H-linearity default setting
Freq.
Range
KHz
Resolution
@Hz
DAC
Value
1
~33.0
720*400 @ 70.0
85
2
33.0~36.0
800*600 @ 35.2
100
3
36.0~42.0
640*480 @ 75.0
105
4
42.0~45.0
640*480 @ 85.0
120
5
45.0~47.5
800*600 @ 75.0
120
6
47.5~49.0
1024*768 @ 60.0
125
7
49.0~52.0
832*624 @ 74.5
125
8
52.0~55.0
800*600 @ 85.0
135
9
55.0~58.5
1024*768 @ 70.0
135
10
58.5~61.5
1024*768 @ 75.0
140
11
61.5~65.0
1280*1024 @ 60.0
140
12
65.0~70.0
1024*768 @ 85.0
150
13
70.0~73.0
1125*900 @ 76.0
155
14
73.0~76.0
1600*1200 @ 60.0
155
15
76.0~80.6
1152*864 @ 85.0
165
16
80.6~82.5
1600*1200 @ 65.0
165
17
82.5~84.8
1792*1344 @ 60.0
165
18
84.8~88.5
1600*1200 @ 70.0
165
19
88.8~92.5
1280*1024 @ 85.0
175
20
92.5~98.0
1600*1200 @ 75.0
175
21
98.0~102.0
1600*1200 @ 80.0
175
22
102.0~110.0
1792*1344 @ 75.0
175
23
110.0~113.5
1920*1440 @ 75.0
180
24
113.5~122.0
2048*1536 @75.0
170
25
122.0~126.5
1856*1392 @ 85.0
185
26
126.5~
1920*1440 @ 85.0
185
27
130
2048*[email protected]
185
8.2
Alignment of horizontal and vertical geometry.
8.2.0
Enable the MAGNETIC function in the MODEL SELEC (
factory mode OSD).
8.2.1
Apply the timing mode 2048x1536 120kHz 75Hz (timing
table 35), pattern FIG.1 to FIG.4 to set under tested.
Correct the test image to display in parallel with front top
plastic bezel by adjusting the Rotate item in OSD Adjust
shape. Repeatedly do the adjustments from 8.2.2 to
8.2.13 to correct the geometry of this mode and fix the
position of horizontal raster on display screen.
8.2.2
Adjust Raster H (in factory mode) to make the horizontal
raster symmetrical display at center of the screen.
8.2.3
Adjust the H-Width to 392mm.
8.2.4
Adjust the H-linearity to get optimum horizontal deflection
linearity display block to block.
8.2.5
Adjust the H-Phase to center position.
8.2.6
Adjust the side curve - Pincushion & Balance to get
optimum right vertical lines.
8.2.7
Adjust the side angles - Trapezoid & Parallelogram to
get optimum right vertical lines.
8.2.8
Adjust the Corner Top & Bottom to get optimum right
vertical lines.
8.2.9
Adjust the Vertical size to 294 mm.
8.2.10
Adjust the vertical linearity to get optimum vertical
deflection linearity display block to block.
8.2.11
just the Vertical phase to center.
8.2.12
epeatedly do the adjustments from 8.2.3 to 8.2.11
to optimize the geometry performances and meet the
specification (sheet 161) request.
8.2.13
Exit OSD and auto saves the alignment data.
8.2.14
Repeat the procedure of 8.2.2 - 8.2.13 to all inspection (
preset) & alignment modes listed in the following Factory
timing modes table (total 11 modes) until all have been
adjusted completely.
Содержание 202P70/00
Страница 37: ...37 202P7 CRT Go to cover page Wiring Diagram ...
Страница 40: ...40 Main Schematic Diagram Go to cover page 202P7 CRT C1 224V C2 C3 224V C4 C5 C6 C7 C8 C9 C13 C12 C11 C10 101V ...
Страница 41: ...41 202P7 CRT Go to cover page Main Board C B A 1 ...
Страница 42: ...42 Main Board C B A 2 Go to cover page 202P7 CRT ...
Страница 44: ...44 Go to cover page Video Board C B A 1 202P7 CRT ...
Страница 45: ...45 202P7 CRT Go to cover page Video Board C B A 2 ...
Страница 47: ...47 202P7 CRT Go to cover page TERMINAL Board C B A 1 ...
Страница 48: ...48 TERMINAL Board C B A 2 Go to cover page 202P7 CRT ...
Страница 50: ...50 Driver Board C B A Go to cover page 202P7 CRT ...
Страница 51: ...51 202P7 CRT Go to cover page KEY CONTROL Schematic Diagram C B A ...
Страница 52: ...52 MHR Schematic Diagram C B A Go to cover page 202P7 CRT ...


