


Moxi Flow
™
User Guide
Page 19
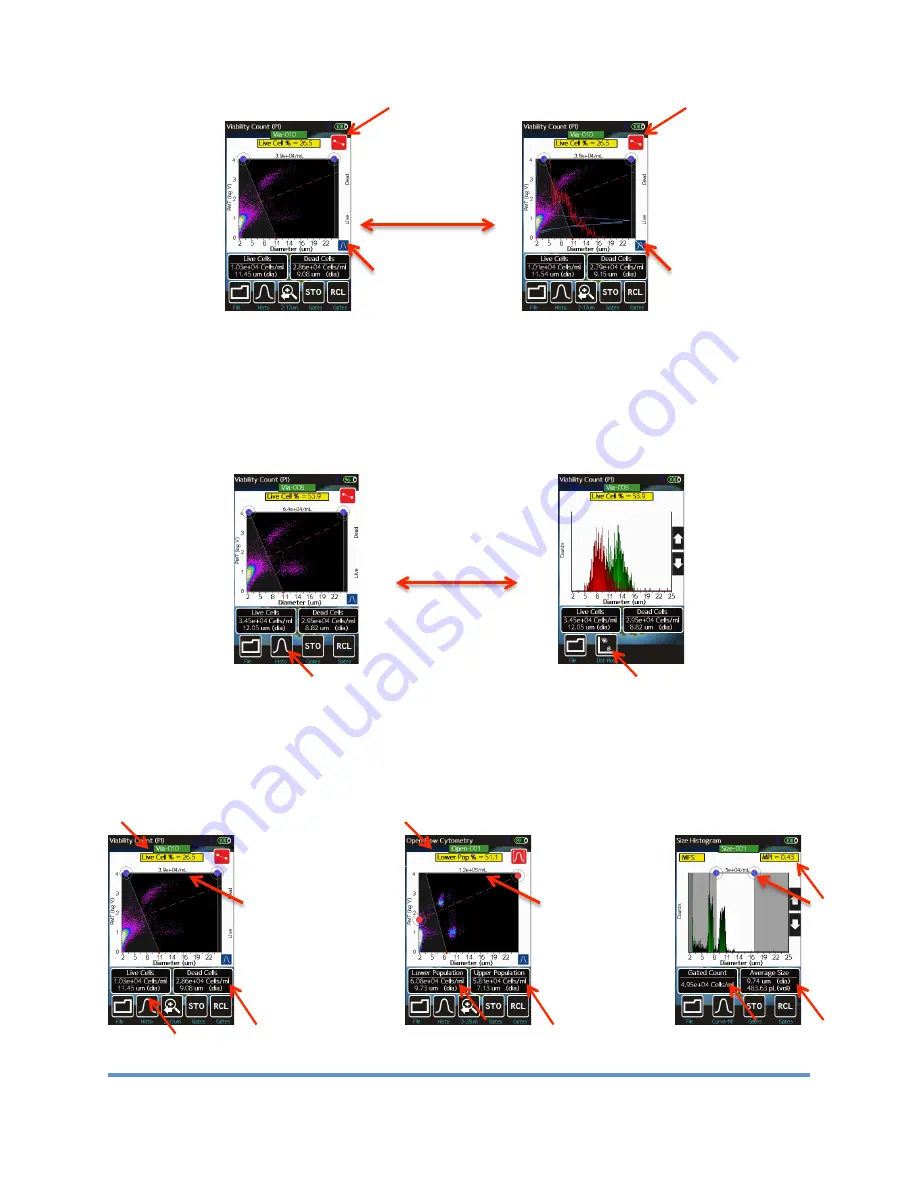
Once properly gated, a histogram representation of the data can also be displayed by touching
the black “
Histo
button (indicated by a red arrow in the image below/left). All (and only the)
data within the size gated region is displayed on the histogram with the events above the
fluorescent (red marker) gate displayed in red and the events below the fluorescent gate
displayed in green (e.g. for a Viability test, the red histogram are the dead cell counts and the
green histogram are the live cell counts). Pressing the
Dot Plot
button returns the screen to
the initial scatter (dot) plot data.
Count, Size, and Percentage Information
The Moxi Flow™ provides particle concentration and precise sizing information for each gated
region, total counts information, and fluorescent percentages for each test. Three example test
output screens are shown below (left to right: Viability Count, Open Flow Cytometry, Size
Histogram).
For the two fluorescent tests (shown above as scatter plots, left and middle plots), the results
Toggle to turn on
fluorescent and size
histogram overlays
.
Switch Between
Scatter (Dot) Plot
and Histogram
Modes


