Nitto Construction
- 18 -
3.5 Allowable range for Each Index Value
Note: Each index value shown below is the experimental value and only the reference value.
It is possible to change significantly depending on the types and conditions of the concrete. It
does not guarantee the condition or strength of the concrete.
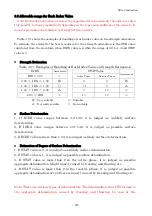
Table 3.5-1 shows the examples of handling of each index value on the strength estimation.
To estimate the strength, the best waveform for the strength estimation is the STR value
calculated from the waveform when INDX value is within the range of 0.9 to 1.3 and STAT
value is 0
Strength Estimation
Table 3.5-1 Examples of Handling of Each Index Value on Strength Estimation
INDX
Assessment
STAT Value
Assessment
IDX < 0.90
×
Active Phase
Reactive Phase
0.90
≦
IDX
≦
1.30
◎
0 0
◎
1.30
<
IDX
≦
1.50
○
>1 0
△
1.50
<
IDX
<
2.00
△
0 1<
×
2.00
≦
IDX
×
1< 1<
×
◎
:
Very suitable
○:
Suitable
△
:
Not really suitable
×:
Not suitable
Surface Deterioration
1. If INDX value ranges between 0.9-1.30, it is judged as unlikely surface
deterioration.
2. If INDX value ranges between 1.31-1.49, it is judged as possible surface
deterioration.
3. If INDX value is more than 1.50, it is judged as likely surface deterioration.
Estimation of Degree of Surface Delamination
1. If STAT value is 0, it is judged as unlikely surface delamination.
2. If STAT value is 1, it is judged as possible surface delamination.
3. If STAT value is more than 2 in the active phase, it is judged as possible
aggregate delamination (slight injury) caused by freezing and thawing etc.
4. If STAT value is more than 2 in the reactive phase, it is judged as possible
aggregate delamination or void (severe injury) caused by freezing and thawing etc.
Note: There are various types of delamination. The delamination that CTS focuses is
the aggregate delamination caused by freezing and thawing. In case of the
Содержание CTS-02V4
Страница 1: ...CTS 02V4 User Manual...


