- 36 -
6.2
Viewing the Histogram
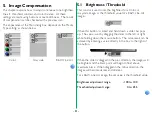
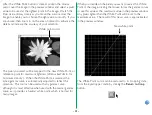
At times it may be useful to view the histogram of the preview
image. A histogram is a statistical representation of the
densities in an image. A histogram will be displayed when the
Histogram button is clicked and held. This control is active
when either Grayscale or Color is selected as the Media Type
in the Main dialog box.
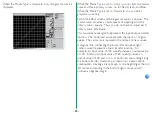
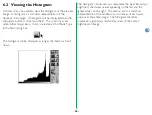
The histogram will be displayed as long as the button is held
down.
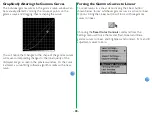
The histogram’s horizontal axis represents the pixel intensity or
brightness, the darker values appearing on the left and the
lighter values on the right. The vertical axis is a statistical
representation of the number of occurrences of each pixel
value over the entire image. The histogram therefore
represents a graphical and statistical view of the overall
brightness an image.


