PSM3750 Quick User Guide
Page 35
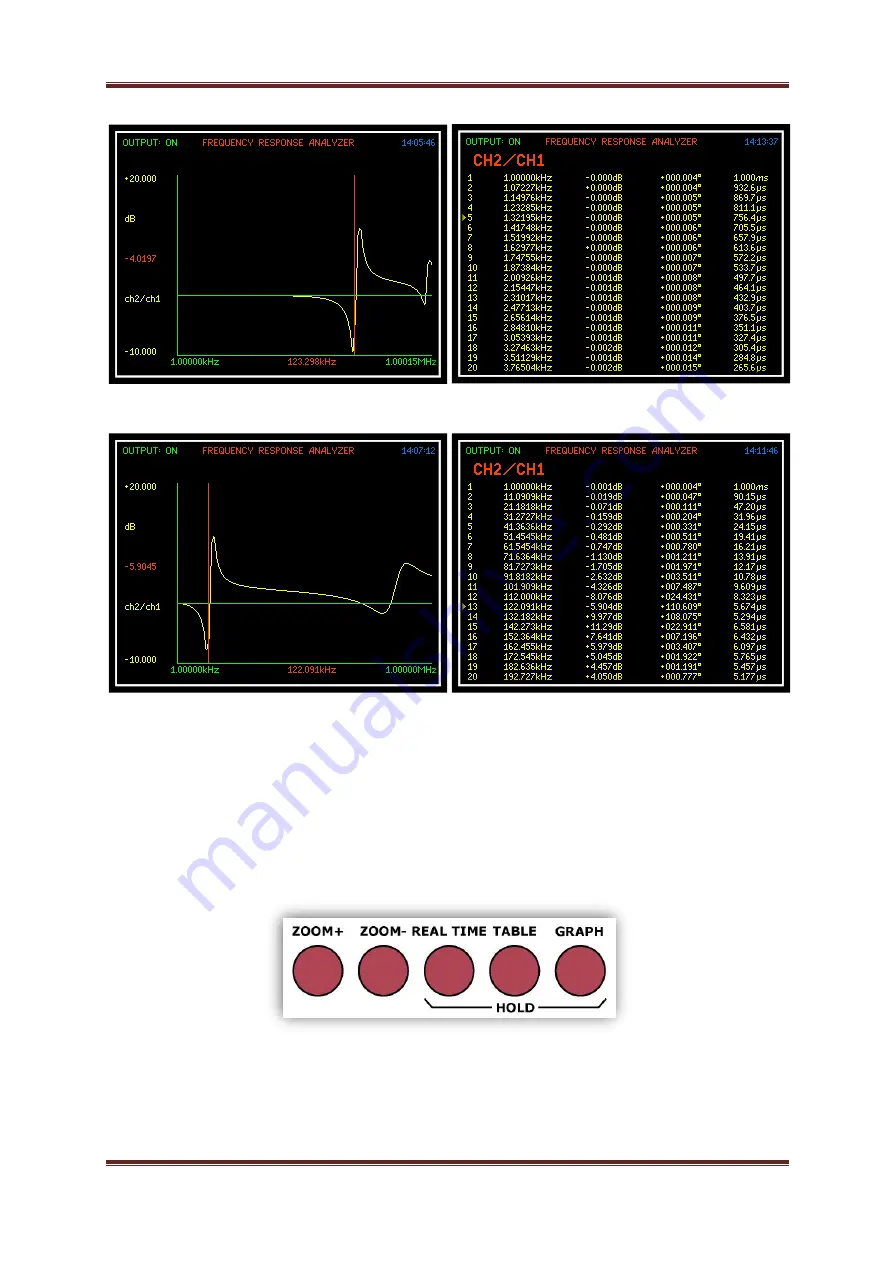
Graph and Table results from a sweep set to “Linear”
Graph and Table res
ults from a sweep set to “Log”
To view the Graph or Table data as displayed above either during or upon the
completion of a sweep, push the appropriate button from the instruments front
panel.


