The Interface Solution Experts
19
THZ
2
&
TDZ
2
Programmable Smart HART
Temperature Transmitter and Display
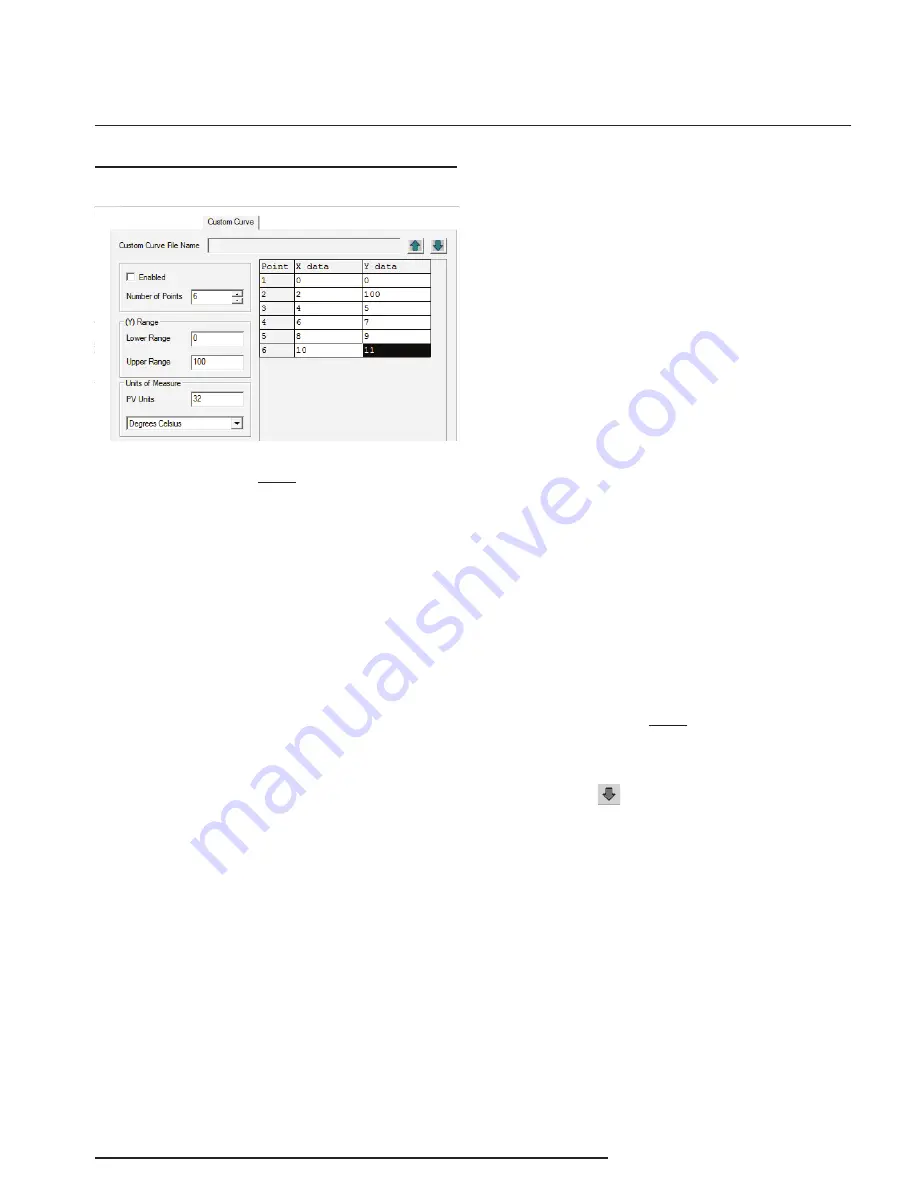
Custom Curve
Note:
Using the Custom Curve feature will disable the
Scaling capability. Since both are scaling features
used to manipulate the appearance of your process
variable, only one of these functions may be used at
a time.
Custom Curve–
The Custom Curve feature allows you
to set up your own custom curve table. This allows
you to tell the transmitter what it should output when it
receives a certain input. This feature also allows you
the ability to write a table in Microsoft
®
Excel, save it
in a .csv format, and import it into the Configuration
Software. This makes it simple to save the custom
table for downloading to multiple units or for backup
purposes.
To create a custom curve:
1. Click the
Enabled
box.
2. Select the number of points for your curve
(128 points maximum) and enter it into the
No Of Points
text box.
3. In the
Custom Curve (Y) Range
text boxes,
enter the values you wish displayed, and
represented as your 4-20mA span, when
your input is at its upper and lower ranges.
4. Type your individual values in the
X data
and
Ydata
columns. Source variables
are inserted into the X Column, while the
corresponding data is inserted into the Y
Column.
5. After all of your data has been entered, you
must
use the
Custom Curve
dropdown menu
to save your newly created custom table
(
Save Custom Curve
) and to download it to
your instrument (
Download Custom Curve
).
Custom Curve PV Units of Measure–
Use this to
select a preset HART EGU process variable display for
your custom curve values. These HART EGU codes
are compatible with HART Revision 5, and earlier,
communications.
To customize your display and set your own EGU,
open the
Display
screen and use the
Custom Label
feature.
Note:
Once you have configured all parameters, download
to the unit by selecting “Download” in the Transfer
dropdown menu located in the Status Bar. Or, click
the button in the Tool Bar.
Figure 13.
Custom Curve Tab


