36
5-4. Peakcut Control Status
This section explains how to check the Peakcut control status.
Click [Energy Management] in the menu bar, and then click [Peakcut Control Status] to access the Peakcut
Control Status screen.
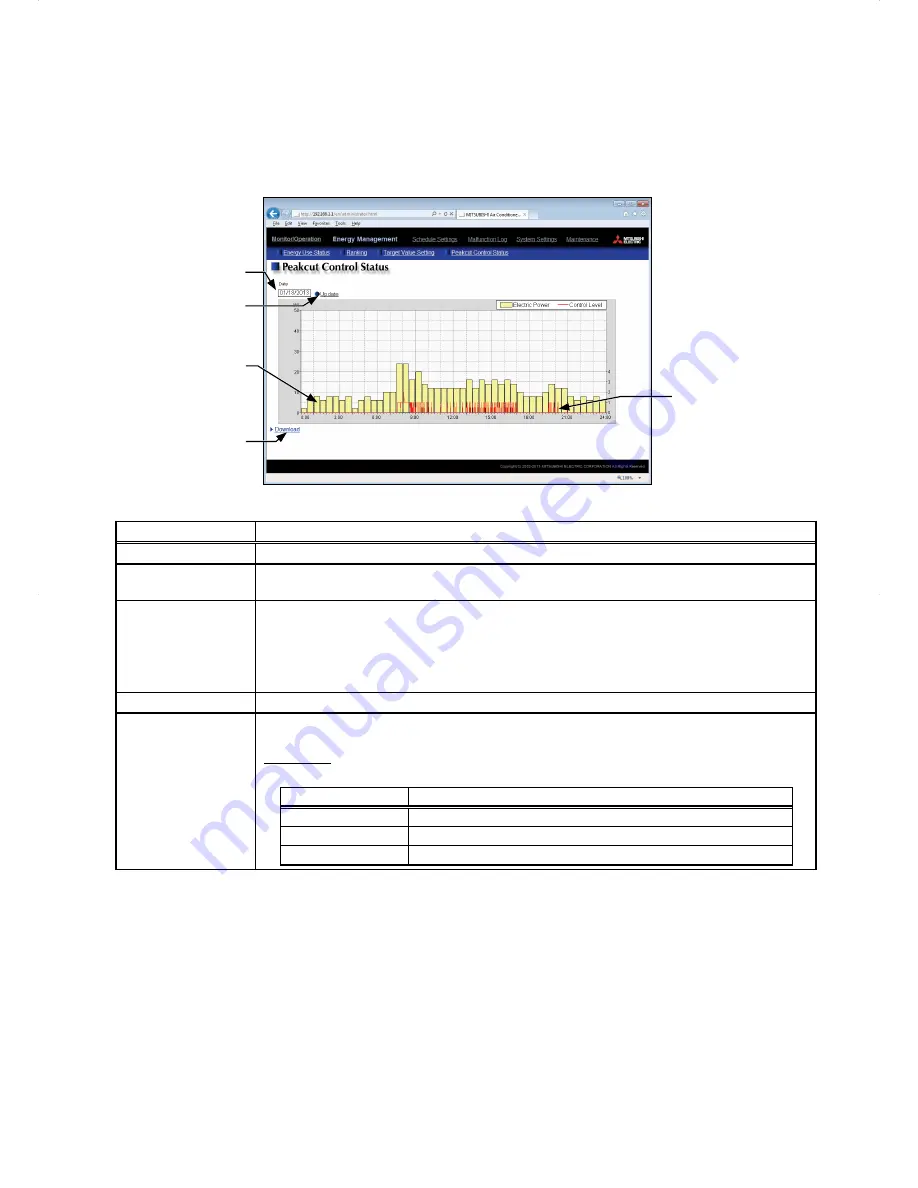
The average electric power consumption (kW) and the control level will appear in the graph. The measurement
data can be exported in a CSV format from the screen.
Average electric power
Control level
Download
Click to export the data in
the CSV format.
Update
Click to show the most
recent measurement data.
Measurement date
Item
Description
Update
Click to show the most recent measurement data.
Measurement date
Select the measurement date.
Note: The data of the past three days including the current day can be displayed.
Average electric
power
Average electric power consumption (kW) will appear in 30-minute increments.
Note: Average electric power consumption data are stored every hour and half hour. If a power failure
occurs, up to 30-minute worth of data will be lost.
Note: The graph can be displayed only when the Peak Cut method is set to [Electric Amount Count
PLC] or [PI Controller] on the Peak Cut settings screen, accessible via the Web Browser for Initial
Settings.
Control level
Peak Cut control level will appear in 1-minute increments.
Download
Click [Download] to export the measurement data in the CSV format as shown below.
■ File name
Peakcut_[yyyy]-[mm]-[dd].csv
File-name contents
Format
[yyyy]
The year specified in the [Measurement date] field
[mm]
The month specified in the [Measurement date] field
[dd]
The date specified in the [Measurement date] field


