Page 20
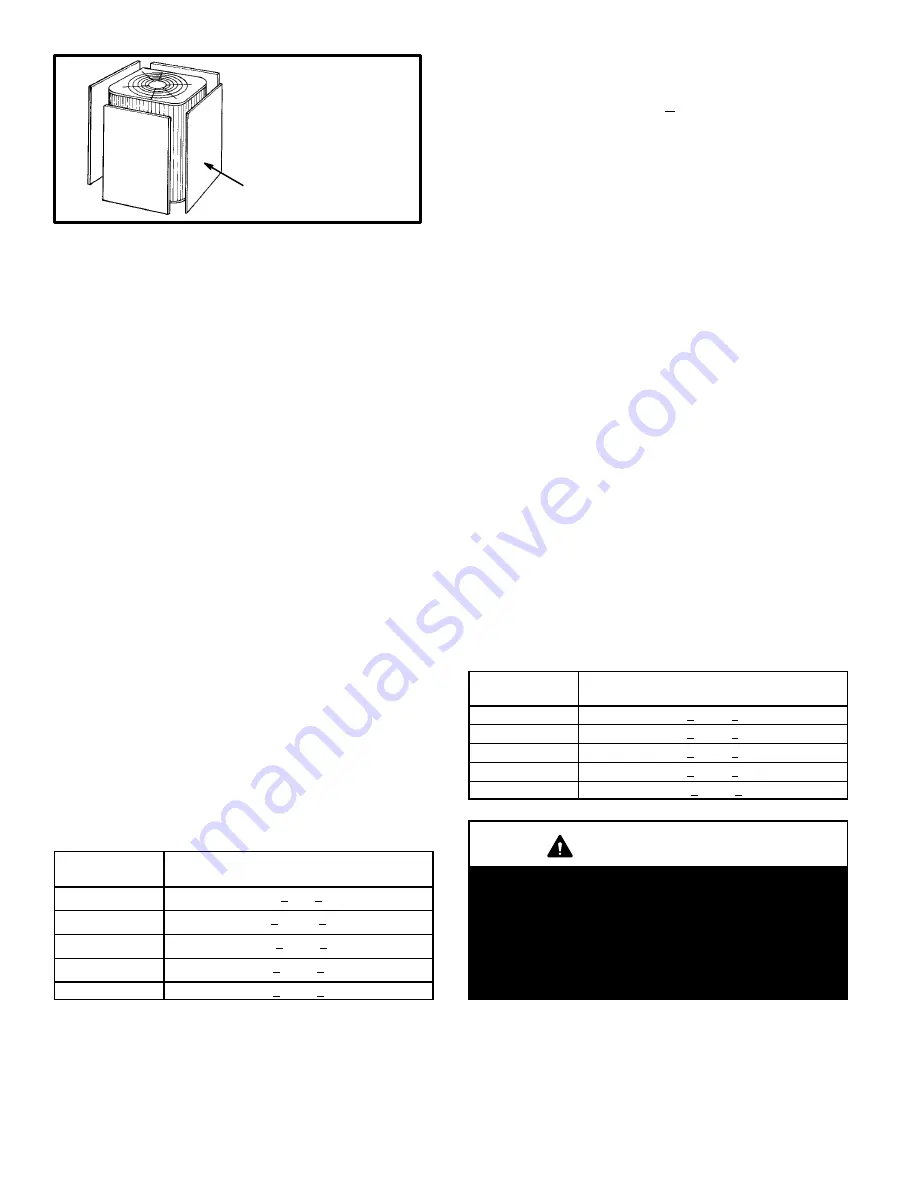
Blocking Outdoor Coil
cardboard or
plastic sheet
Outdoor coil should be
blocked one side
at a time with cardboard
or plastic sheet until proper
testing pressures
are reached.
FIGURE 25
1 − With the manifold gauge hose still on the liquid service
port and the unit operating stably, use a digital ther-
mometer to record the liquid line temperature.
2 − At the same time, record the liquid line pressure reading.
3 − Use a temperature/pressure chart for R410A to deter-
mine the saturation temperature for the liquid line pres-
sure reading. See table 14.
4 − Subtract the liquid line temperature from the saturation
temperature (according to the chart) to determine sub-
cooling.
(Saturation temperature − Liquid line tem-
perature = Subcooling)
5 − Compare the subcooling value with those in table 10. If
subcooling is greater than shown, recover some refrig-
erant. If subcooling is less than shown, add some re-
frigerant. Be aware of the R410A refrigerant cylinder. It
will be light maroon−colored. Refrigerant should be
added through the vapor line valve in the liquid state.
Some R410A cylinders are equipped with a dip
tube that allows you to draw liquid refrigerant from
the bottom of the cylinder without turning the cyl-
inder upside−down. The cylinder will be marked if it
is equipped with a dip tube.
TABLE 10
2nd stage High Capacity
Model Number
Subcooling Values
Conversion Temp. − Liquid Line Temp.
°
F (
°
C)
HPXA19−024
11.0 + 1 (6 + .5)
HPXA19−036
8.5 + 1 (4.7 + .5)
HPXA19−038
10.5 + 1 (5.8 + .5)
HPXA19−048
7.5 + 1 (4.1 + .5)
HPXA19−060
7.0 + 1 (3.9 + .5)
Charging Using Normal Operating Pressures
and the Approach Method
Outdoor Temp. > 65
F (18
C)
The following procedure is intended as a general guide and
is for use on expansion valve systems only. For best results,
indoor temperature should be 70°F (21°C) to 80°F (26°C).
Monitor system pressures while charging.
1 − Record outdoor ambient temperature using a digital
thermometer.
2 − Attach high pressure gauge set and operate unit for
several minutes to allow system pressures to stabilize.
3 − Compare stabilized pressures with those provided in
tables 12 and 13, Normal Operating Pressures." Mi-
nor variations in these pressures may be expected due
to differences in installations. Significant differences
could mean that the system is not properly charged or
that a problem exists with some component in the sys-
tem. Pressures higher than those listed indicate that
the system is overcharged. Pressures lower than
those listed indicate that the system is undercharged.
Verify adjusted charge using the approach method.
Approach Method
4 − Use the same digital thermometer used to check out-
door ambient temperature to check liquid line tempera-
ture. Verify the unit charge using the approach method.
5 − The difference between the ambient and liquid temper-
atures should match values given in table 11. If the val-
ues don’t agree with the those in table 11, add refriger-
ant to lower the approach temperature or recover re-
frigerant from the system to increase the approach
temperature.
TABLE 11
2nd Stage High Capacity
Model Number
Approach Temperature
Liquid Line Temp. − Outdoor Ambient °F (°C)
HPXA19−024
4.0 + 1 (2.2 + .5)
HPXA19−036
7.0 + 1 (3.9 + .5)
HPXA19−038
4.0 + 1 (2.2 + .5)
HPXA19−048
8.0 + 1 (4.4 + .5)
HPXA19−060
10.0 + 1 (5.6 + .5)
IMPORTANT
Use table 12 and table 13 as a general guide when
performing maintenance checks. This is not a proce-
dure for charging the unit (Refer to Charging/Check-
ing Charge section). Minor variations in these pres-
sures may be expected due to differences in installa-
tions. Significant differences could mean that the
system is not properly charged or that a problem ex-
ists with some component in the system.


