

38
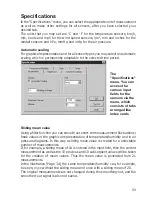
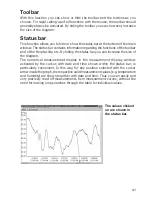
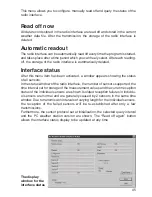
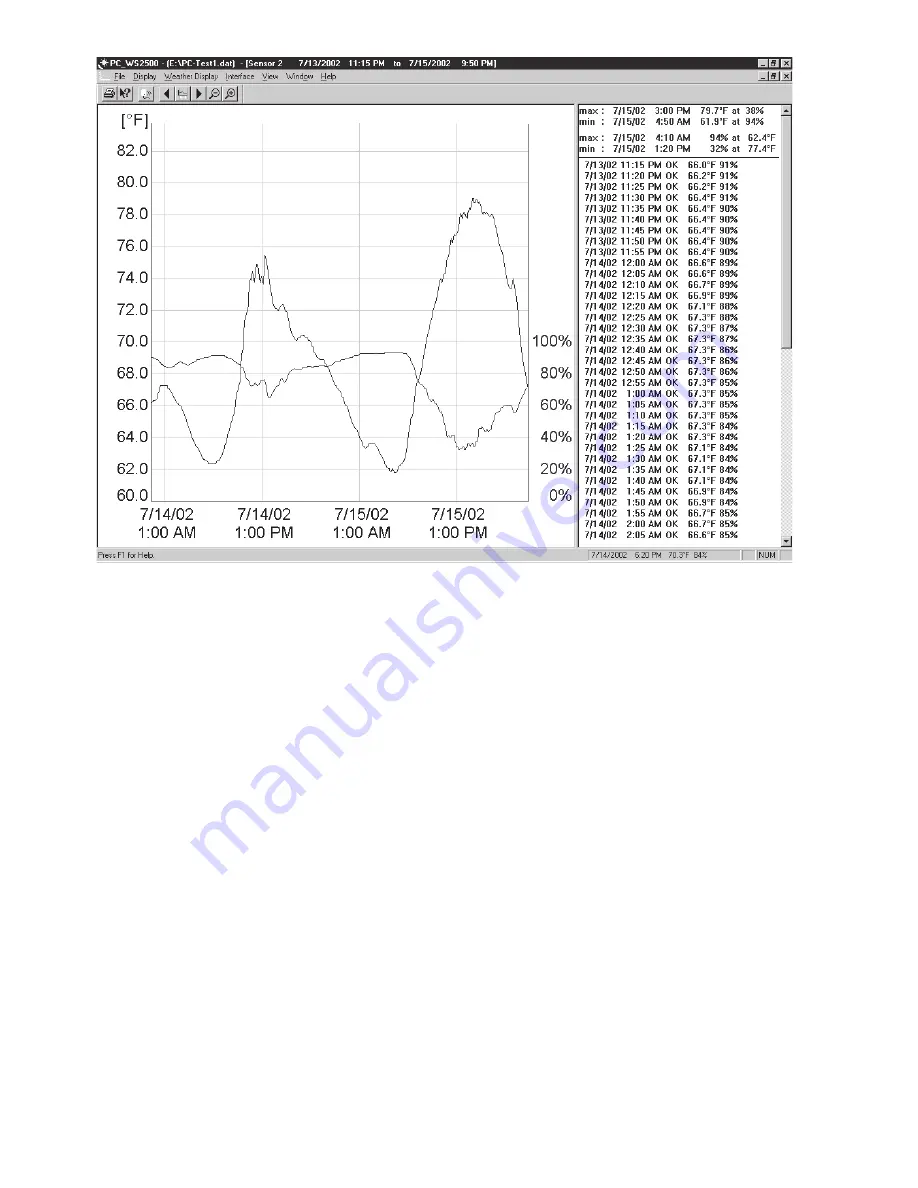
The minimum and maximum values obtained during the display period are always
shown in the top part of the tabular representation, together with the date and
time of the occurrence of the extreme values.
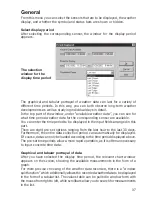
It is also possible to display each individual measurement window in such a way
that it fills the entire screen.
Temperature/humidity
Menu for selecting the temperature/humidity sensor to be shown in the display.
After selecting the corresponding sensor, the window for the display period
appears.
Once you have selected this, the graph/table is shown.
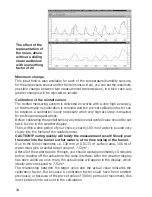
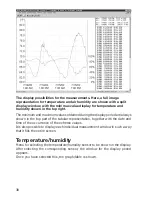
The display possibilities for the measurements. Here, a full image
representation for temperature and air humidity are shown with a split
display window, with the min/max value display for temperature and
humidity shown in the top right.
Содержание WS-2510
Страница 3: ...3 ...
Страница 9: ...9 Chapter 1 Introduction ...
Страница 16: ...16 ...
Страница 17: ...17 Chapter 2 Starting operation ...
Страница 28: ...28 Chapter 3 File menu ...
Страница 36: ...36 Chapter 4 Display menu ...
Страница 42: ...42 Chapter 5 Weather display menu ...
Страница 44: ...44 Chapter 6 Interface menu ...
Страница 49: ...49 ...
Страница 50: ...50 Chapter 7 View menu ...
Страница 75: ...75 ...


