Step 3
View real-time performance data of remote replication.
NOTE
You can click
Set Parameters
in the upper function pane of the performance monitoring interface to go
to the
Set Performance Monitoring Parameters
page and enable performance monitoring.
l
Viewing real-time performance data in single-figure display mode
NOTE
If you want to view the graphs of all performance indicators in one figure, use the single-figure
display mode.
a.
When selecting the view mode, click .
b.
In the
Monitored Object
dialog box, select remote replication for
Object Type
and
select the remote replication pair that you want to monitor. In this case, select
LUN
P→LUN S
. You can select multiple remote replication pairs to view their
performance indicators.
c.
In the
Statistical Indicators
dialog box, select the performance indicators that you
want to view. In this case,
Logical Bandwidth (MB/s)
,
Interval since last
synchronization (s)
,
Time Difference(s)
, and
SynchronizationDuration (s)
.
d.
View real-time performance data on the right function pane.
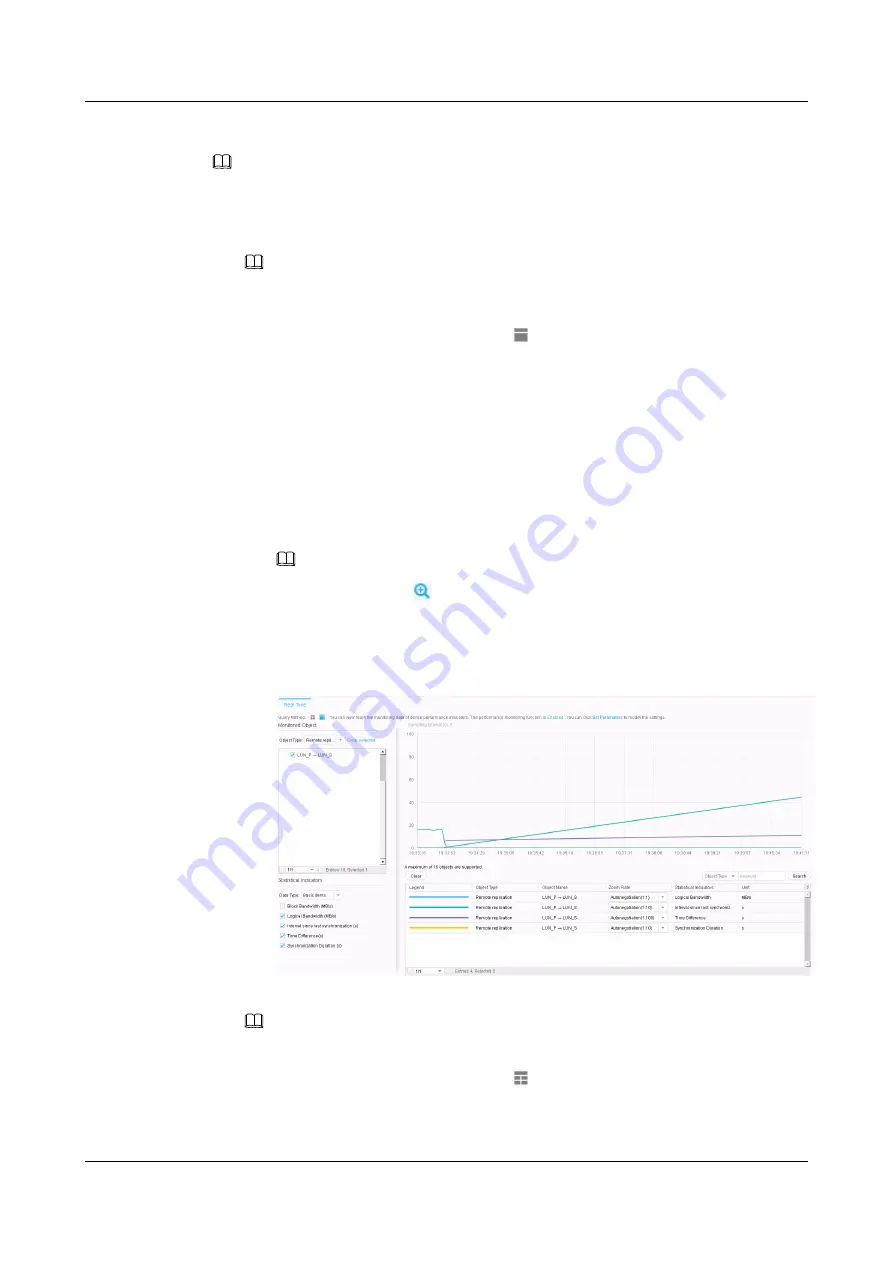
As shown in
, graphs of the performance indicators are displayed.
NOTE
n
You can click
in the upper right corner to view details of the performance data.
n
When you move the mouse pointer over a performance data sampling point in the
graph, the corresponding sampling value and time are displayed.
Figure 6-1
Viewing real-time performance data (single-figure display)
l
Viewing real-time performance monitoring data in multi-figure display mode
NOTE
If you want one figure to display one performance indicator, use the multi-figure display mode.
a.
When selecting the view mode, click .
b.
In the
Monitored Object
dialog box, select remote replication for
Object Type
and
select the remote replication pair that you want to monitor. In this case, select
LUN
OceanStor V3 Series
Remote Replication Feature Guide for Block
6 Managing Remote Replication
Issue 06 (2018-01-30)
Huawei Proprietary and Confidential
Copyright © Huawei Technologies Co., Ltd.
120


