


VEGA78
EN - 60
Example of advanced graph.
Let us take a recording of 2000 pixels into consideration. The PQA has a display with a
useful resolution of about 200 pixels; therefore, it is not able to distinctly display all the
pixels in our recording. How does it operate then? The first pixel in the graphs of the
curves “Max value”, “Average value” and “Min value” will be the analysis of the 10 first
corresponding pixels of the recording, i.e.:
-
For the Max value graph, the highest value of the 10 recorded values for the
corresponding channel will be displayed.
-
For the Min value graph, the lowest value of the 10 recorded values for the
corresponding channel will be displayed.
-
For the Average value graph, the first value of the 10 recorded values for the
corresponding channel will be displayed.
Similarly, the second pixel will be the analysis of the following 10 pixels, and so on until the
whole graph is generated.
3. Press the
ESC
key (or the smart icon ) to exit the function and go back to the
“Selecting a parameter” page (Fig. 90).
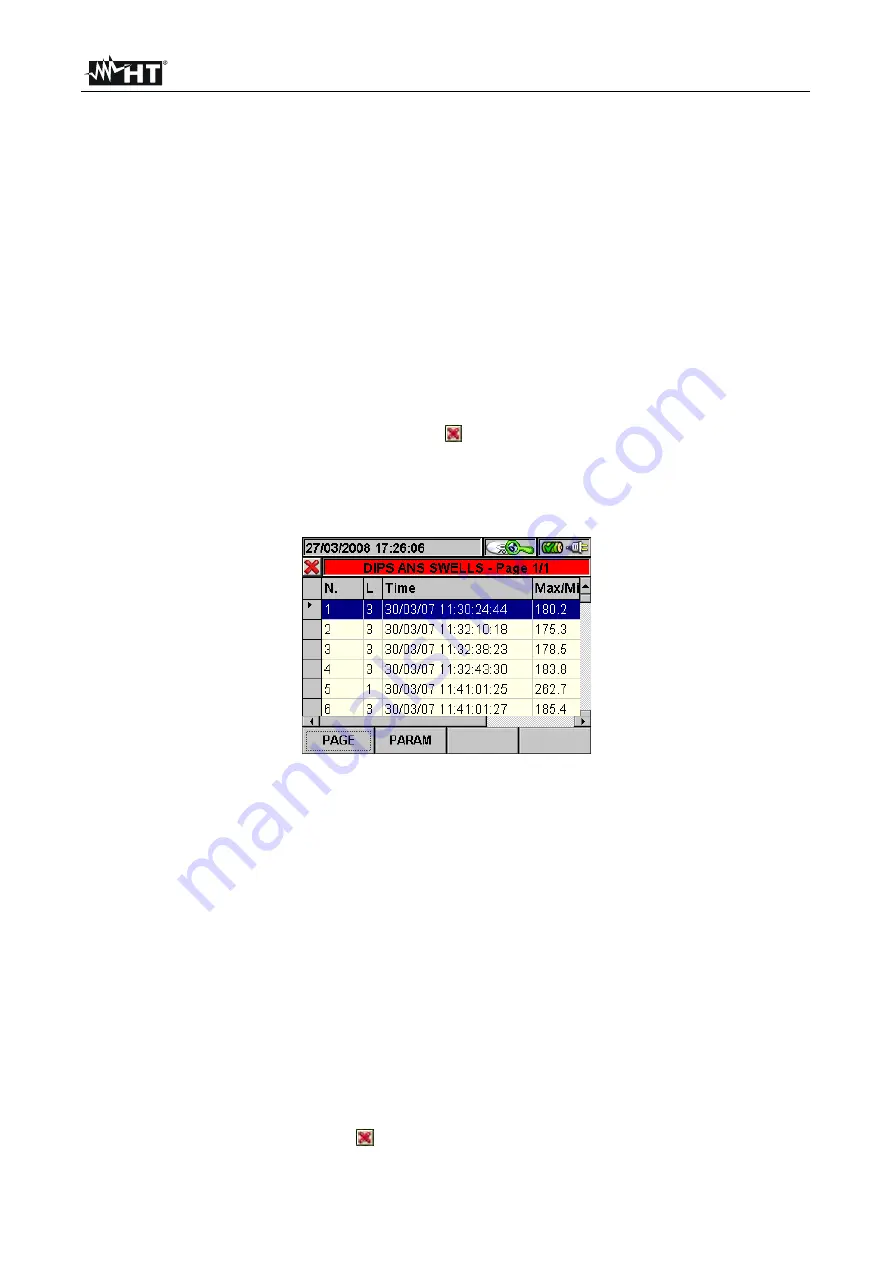
5.5.1.3. Dips ans swells
This page shows a table containing all voltage anomalies occurred during recording.
Fig. 94: Dips ans swells
Column description:
N.
:
Progressive number of the anomaly.
L.
:
Phase in which the anomaly occurred.
Date/Time
: Date/time at which the anomaly occurred.
Max/Min
: Maximum/minimum value of the anomaly.
Duration
: Duration of the anomaly.
Type
:
Type of anomaly (voltage reduction or overvoltage).
The following keys are active on this page:
The up and down arrow keys move the cursor along the voltage anomalies.
The up and down arrow keys move the column display to the right or to the left.
The
F1
key (or the
PAG
item on the display) advances to the following page of voltage
anomalies (to be selected with the
F3
or
F4
key or through the items
MOD (+)
or
MOD
(-)
on the display).
The
F2
key (or the
PARAM
item on the display) accesses the page showing the
settings for voltage anomalies (Fig. 95).
The
ESC
key (or smart icon ) to exit the function and go back to the “Recording
analysis” page (Fig. 88).
Shop for Power Metering products online at:
1.888.610.7664
www.
PowerMeterStore
.com


