


Using the ProCurve Web Browser Interface
Status Reporting Features
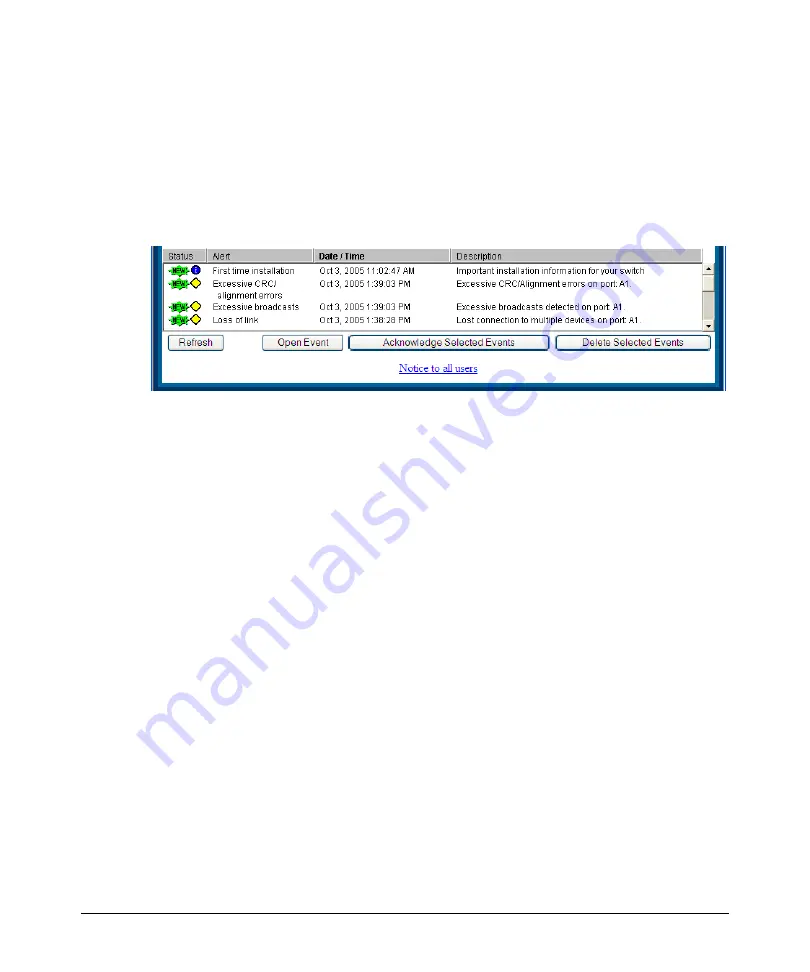
The Alert Log
The web browser interface Alert Log, shown in the lower half of the screen,
shows a list of network occurrences, or
alerts
, that were detected by the
switch. Typical alerts are
Broadcast Storm
, indicating an excessive number of
broadcasts received on a port, and
Problem Cable
, indicating a faulty cable. A
full list of alerts is shown in the table on page 5-21.
Figure 5-13. Example of the Alert Log
Each alert has the following fields of information:
■
Status
– The level of severity of the event generated. Severity levels can
be Information, Normal, Warning, and Critical. If the alert is new (has not
yet been acknowledged), the New symbol is also in the Status column.
■
Alert
– The specific event identification.
■
Date/Time
– The date and time the event was received by the web
browser interface. This value is shown in the format:
DD-MM-YY
HH:MM:SS
AM/PM
, for example,
16-Sep-99 7:58:44 AM
.
■
Description
– A short narrative statement that describes the event. For
example,
Excessive CRC/Alignment errors on port: 8
.
Sorting the Alert Log Entries
The alerts are sorted, by default, by the Date/Time field with the most recent
alert listed at the top of the list. The second most recent alert is displayed
below the top alert and so on. If alerts occurred at the same time, the
simultaneous alerts are sorted by order in which they appear in the MIB.
Bold
characters in a column heading indicate that the alert field alert log
entries. You can sort by any of the other columns by clicking on the column
heading. The
Alert
and
Description
columns are sorted alphabetically, while
the
Status
column is sorted by severity type, with more critical severity
indicators appearing above less critical indicators.
5-20
Содержание ProCurve 1600M
Страница 1: ...Management and Configuration Guide 8200zl ProCurve Switches K 12 XX www procurve com ...
Страница 2: ......
Страница 3: ...ProCurve Series 8200zl Switches September 2007 K 12 xx Management and Configuration Guide ...
Страница 68: ...Using the Menu Interface Where To Go From Here 3 16 ...
Страница 110: ...Using the ProCurve Web Browser Interface Status Reporting Features 5 26 ...
Страница 152: ...Switch Memory and Configuration Multiple Configuration Files 6 42 ...
Страница 192: ...Configuring IP Addressing IP Preserve Retaining VLAN 1 IP Addressing Across Configuration File Downloads 8 24 ...
Страница 220: ...Time Protocols SNTP Messages in the Event Log 9 28 ...
Страница 252: ...Port Status and Configuration Uni Directional Link Detection UDLD 10 32 ...
Страница 282: ...Power Over Ethernet PoE Operation PoE Operating Notes 11 30 ...
Страница 472: ...Redundancy Switch 8212zl Event Log Messages 15 48 ...
Страница 510: ...File Transfers Copying Diagnostic Data to a Remote Host USB Device PC or UNIX Workstation A 38 ...
Страница 584: ...Monitoring and Analyzing Switch Operation Locating a Device B 74 ...
Страница 652: ...Troubleshooting Restoring a Flash Image C 68 ...
Страница 660: ...MAC Address Management Viewing the MAC Addresses of Connected Devices D 8 ...
Страница 666: ...Monitoring Resources When Insufficient Resources Are Available E 6 ...
Страница 670: ...Daylight Savings Time on ProCurve Switches F 4 ...
Страница 688: ...18 Index ...
Страница 689: ......


