


OpenFlow Monitor
The SDN controller UI includes several screens providing information on OpenFlow enabled
switches:
•
•
“OpenFlow topology ” (page 61)
•
“OpenFlow Trace log” (page 69)
•
When the controller is active in an OpenFlow domain, the OpenFlow Monitor enables tracking
of switch traffic summaries, packet traffic per port, and applied flow rules for switches detected
in the controller domain.
For a graphical view of Data Path ID assignments to individual OpenFlow switches, see
OpenFlow Monitor screen details
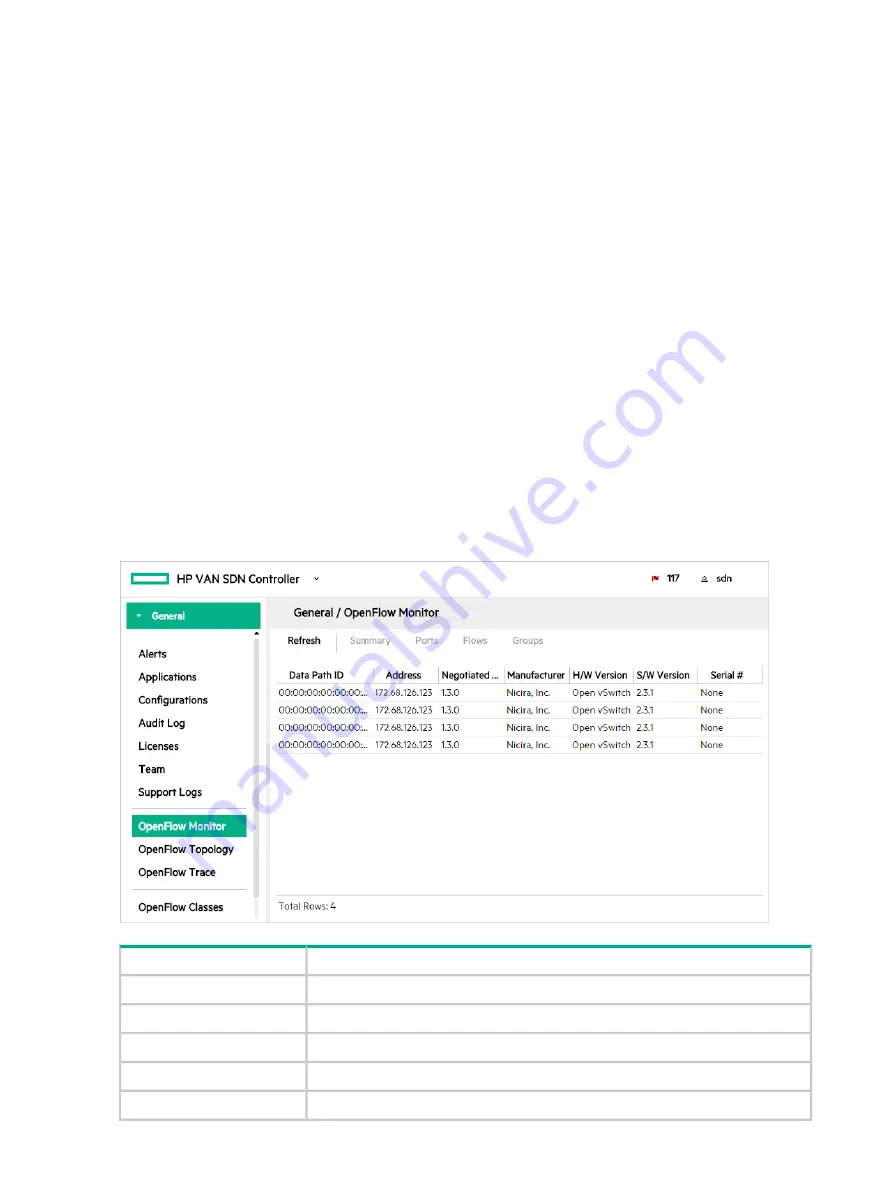
The main display lists the Data Path IDs and descriptive information for the active switches and
the options for viewing traffic information. To view information about a specific device, click the
Data Path ID for that device and then select one of these tabs for the view you want to display:
Summary, Ports, Flows, Groups.
Click
Refresh
to update the display for Topology changes, such as a newly discovered OpenFlow
device or the loss of a device that has been disconnected.
Figure 22 The Main OpenFlow Monitor screen
Description
Screen component
Updates the information displayed on the screen.
Refresh
Displays the
“Summary for data path view” (page 59)
for the selected data path.
Summary
tab
Displays the
“Ports for data path view” (page 60)
for the selected data path.
Ports
tab
Displays the
“Flows for data path view” (page 60)
for the selected data path.
Flows
tab
Displays the
“Groups for data path view” (page 61)
for the selected data path.
Groups
tab
58
Using the SDN controller UI