


Selecting and viewing metrics using JConsole JMX
1.
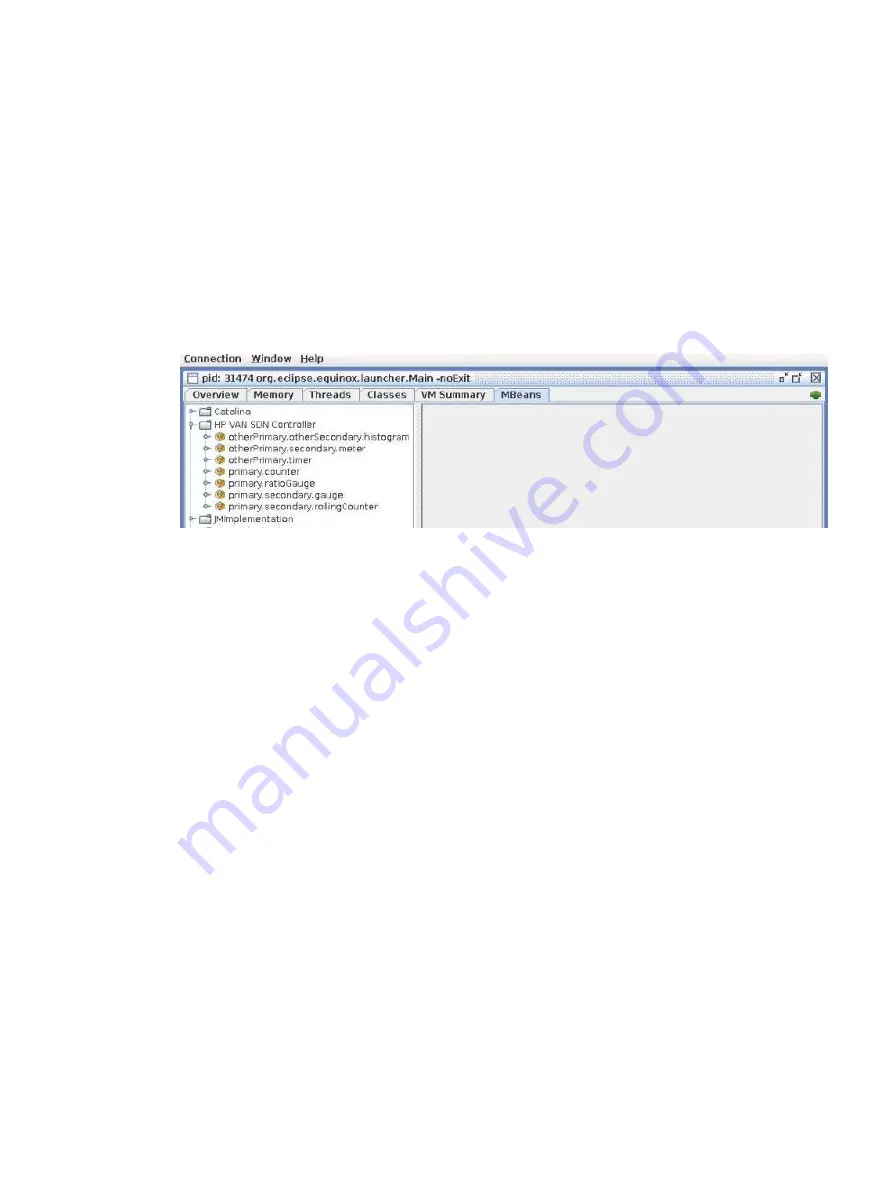
To display the metrics for an application, expand the application folder in the left pane:
•
To view metrics for the HPE VAN SDN Controller and its embedded applications, expand
the folder named
HPE VAN SDN Controller
.
•
To view metrics for an application installed on the controller, expand the folder for the
application.
•
Each application installed on the HPE VAN SDN Controller has a similar node under
which all of the metrics exposed by that application are nested.
•
shows an example of the expanded HPE VAN SDN Controller
application folder with the metrics displayed. Other applications that expose JMX metrics
have folders that are separate from the folder for the HPE VAN SDN Controller.
Figure 68 JConsole window displaying HPE VAN SDN Controller metrics
2.
Expand the metric you want to view.
The name displayed for each
TimeStampedMetric
is a combination of the application ID,
metric name, and (optional) primary and secondary tags that were specified during the
creation of its
MetricDescriptor
. This combination is unique among all
TimeStampedMetric
instances monitored for a specific application. If the optional primary
and secondary tags are not specified, the fields that are provided are used to formulate the
displayed name for the
TimeStampedMetric
.
Viewing current metric data using a JMX client
151