Chapter 9
Sub Network Monitor
General
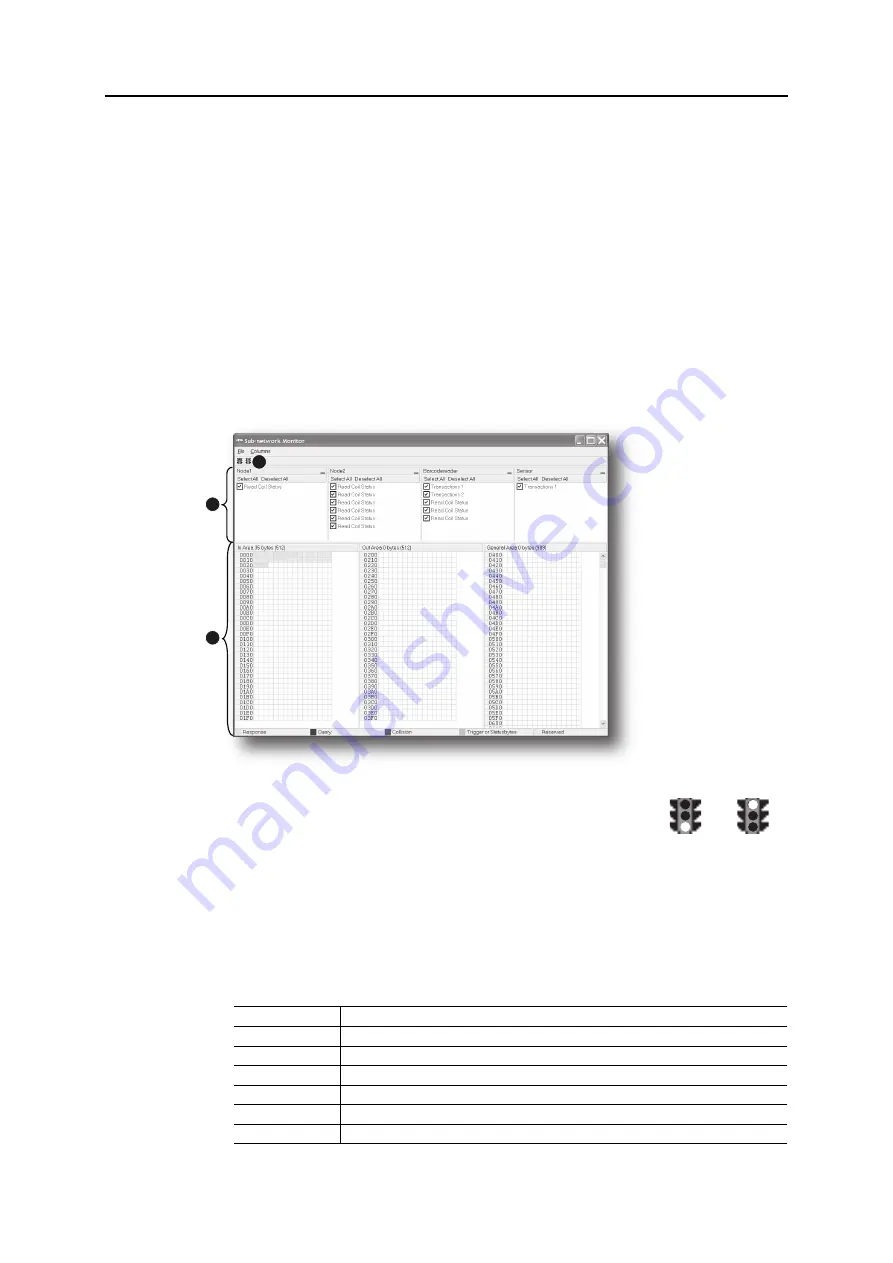
The Sub Network Monitor is intended to simplify configuration and troubleshooting of the sub net-
work. It’s main function is to display the data allocated for sub-network communication and detect if
any area has been allocated twice (i.e if a collision has occurred).
All configured nodes, and their transactions, are listed in the middle of the screen (B). Selecting and de-
selecting single transactions makes it possible to view any combination of allocated data.
Note:
The sub-network monitor has a negative influence on the overall performance of the gateway.
Therefore the monitor functionality should be used with care.
Operation
A: Start Network & Stop Network Icons
These icons controls the sub-network activity. To stop all sub-network
activity, click on the red light. To start the sub-network again, click on
the green light.
B: Nodes / Transactions
To view data blocks associated with a transaction, select the transaction in the list. The corre-
sponding data will then appear in the Monitor Section (C).
C: Monitor Section
This section visualises how data is allocated in the Input, Output and General Data areas.
Colour
Meaning
White
Not allocated.
Yellow
Data allocated by a Response or Consume transaction.
Blue
Data allocated by a Query or Produce transaction
Red
Collision; area has been allocated more than once.
Grey
Reserved (illustrates memory consumption, area can be allocated if necessary)
Green
Data allocated by Trigger byte, Transmit//Receive Counter, or Control/Status Registers.
$
%
&
6WDUW
6WRS


