26
selected point
will
change with the point moving.
Press the
Delete
key
to delete the selected point
.
Press C key to exit point analysis and return to real time thermal image.
“Line Analysis”
Line analysis can be performed on live or zoomed or frozen or saved images.
In live image, bring up the main menu, select “Analysis tool” under submenu “File”, and then select
to do line analysis.
In frozen image, bring up the frozen toolbar, and select line analysis to do line analysis.
In saved images, bring up the Playback toolbar, select line analysis to do line analysis.
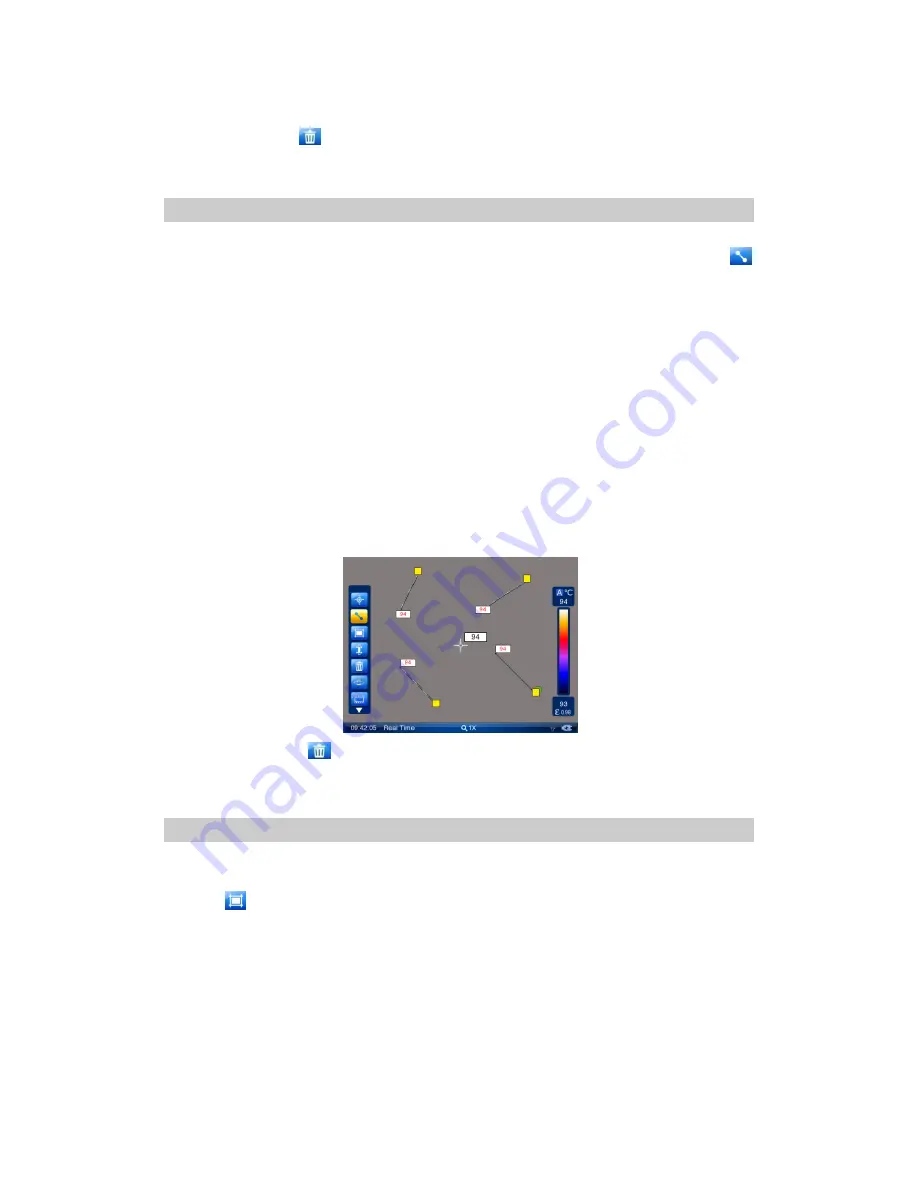
One line can be added by clicking icon line analysis; total 8 lines can be showed in screen.
Many lines will be showed in screen with the yellow box at one end after line adding. When one line is
select, the green arrow will be at the corner of yellow box. To move the line, use the touch pen to drag the
line to the desired position and release. Drag the green right angle to adjust the line angle, and drag the
yellow box to adjust the line length.
Line analysis contains the maximum temperature, minimum temperature and average temperature. The
highest temperature is in red, the lowest temperature is in blue and the average temperature is in black.
The temperature of the line is showed at one end. Maximum, minimum, average temperature function can
be set in the menu.
Press the Delete key
to delete the selected line.
Press the C key to exit line analysis and return to real time infrared image.
Area Analysis
Area analysis can be performed on live or zoomed or frozen or saved images.
In live images, bring up the main menu, select “Analysis Tool” under submenu “File”, and then select the
icon
to do area analysis.
In frozen images, bring up the frozen toolbar, select area analysis to do area analysis.
In saved images, bring up the replay toolbar, select area analysis to do area analysis.
One rectangle area can be added by clicking icon area analysis, total 8 rectangle areas can be showed in
screen.
Use touch pen to switch between the rectangle areas. Green rectangular icon will be showed for the
selected area. The maximum temperature is showed in red, minimum temperature is showed in blue with
automatic tracking. The average temperature is showed in black at the upper-right corner of the rectangle.


