Geophysical Survey Systems, Inc.
UtilityScan with GS Software
Manual
MN71-307 Rev B
10
craggy. To setup the system so that you’re collecting the maximum range of data possible you’ll want to
see some of that noise in the scan trace. If no noise is apparent, then you should increase your depth or
time range until about 25% of the scan trace consists of noise. The noise to signal ratio will change as you
move across your survey area. Keeping some noise on the screen will help ensure that you always collect
the full range of quality signal.
Dielectric:
this value is used to convert the RADAR two-way-travel-time into a depth on the screen. It is
crucial to set this accurately to obtain accurate depths to features. If your vertical scale is set to Depth,
you can use the preset Soil Types to help get you within range of an appropriate dielectric for your
subsurface conditions. There are ways to calibrate it further in the field with focus and ground truth.
•
Depth/Time Range:
See Vertical Scale above for details.
•
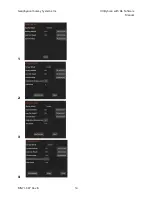
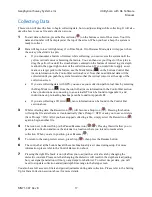
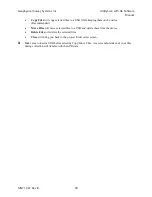
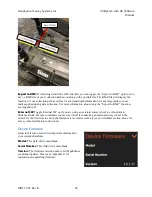
Samples/Scan:
Multiply your Time Range by 10 and divide by 2.5. Use a Samples/Scan set higher
than this value. If your Vertical Scale is set to Depth, toggle it to Time to see this value. Feel free to
switch it back after. GSSI recommends sampling at 512 or 1024 samples/scan for most applications.
•
Scans/Second
•
For Collect Mode: Time, this is your data collection speed. Calculate this value by
considering how many scans/ft or scans/m traveled are required to resolve your targets, as
well as your movement speed. A good default is 50 scans/second.
•
For Collect Mode: Distance and Point, this number represents the maximum possible collect
rate. If you exceed this maximum rate the overspeed beeps will sound. It is recommended
that the scans/second be set lower as lower scan rates will auto stack and improve the signal
to noise ratio. The ideal value for a 350HS antenna is 100 scans/second.
•
Scan Density
•
For Collect Mode: Distance, this is your horizontal data density. A good starting value is 12
scans/ft or 50 scans/m. A lower scan density will result in your data looking more
horizontally condensed, while a higher scan density will result in your data taking up more
horizontal space as more scans are being collected and stacked next to each other per unit of
distance travelled.
•
For Collect Mode: Point, this will control your horizontal scale display. It is not required to
change this value, but if you are aware of how far you will move the antenna during each file
collection you can set this to display the horizontal scale accurately.
•
Scans/Point
•
For Collect Mode: Point only. The higher this value is, the cleaner your data will be.
However, note that higher values will slow down your data collection speed. A good starting
point is 512 samples/point.
Содержание UtilityScan 50350HS
Страница 1: ...MN27 151 Rev A MN71 307 Rev B ...
Страница 4: ...Geophysical Survey Systems Inc UtilityScan with GS Software Manual ...
Страница 6: ...Geophysical Survey Systems Inc UtilityScan with GS Software Manual ...
Страница 8: ...Geophysical Survey Systems Inc UtilityScan with GS Software Manual MN71 307 Rev B 2 ...
Страница 14: ...Geophysical Survey Systems Inc UtilityScan with GS Software Manual MN71 307 Rev B 8 ...
Страница 20: ...Geophysical Survey Systems Inc UtilityScan with GS Software Manual MN71 307 Rev B 14 1 2 3 4 ...
Страница 46: ...Geophysical Survey Systems Inc UtilityScan with GS Software Manual MN71 307 Rev B 40 ...
Страница 47: ...Geophysical Survey Systems Inc UtilityScan with GS Software Manual MN71 307 Rev B 41 ...


