42
Report Views
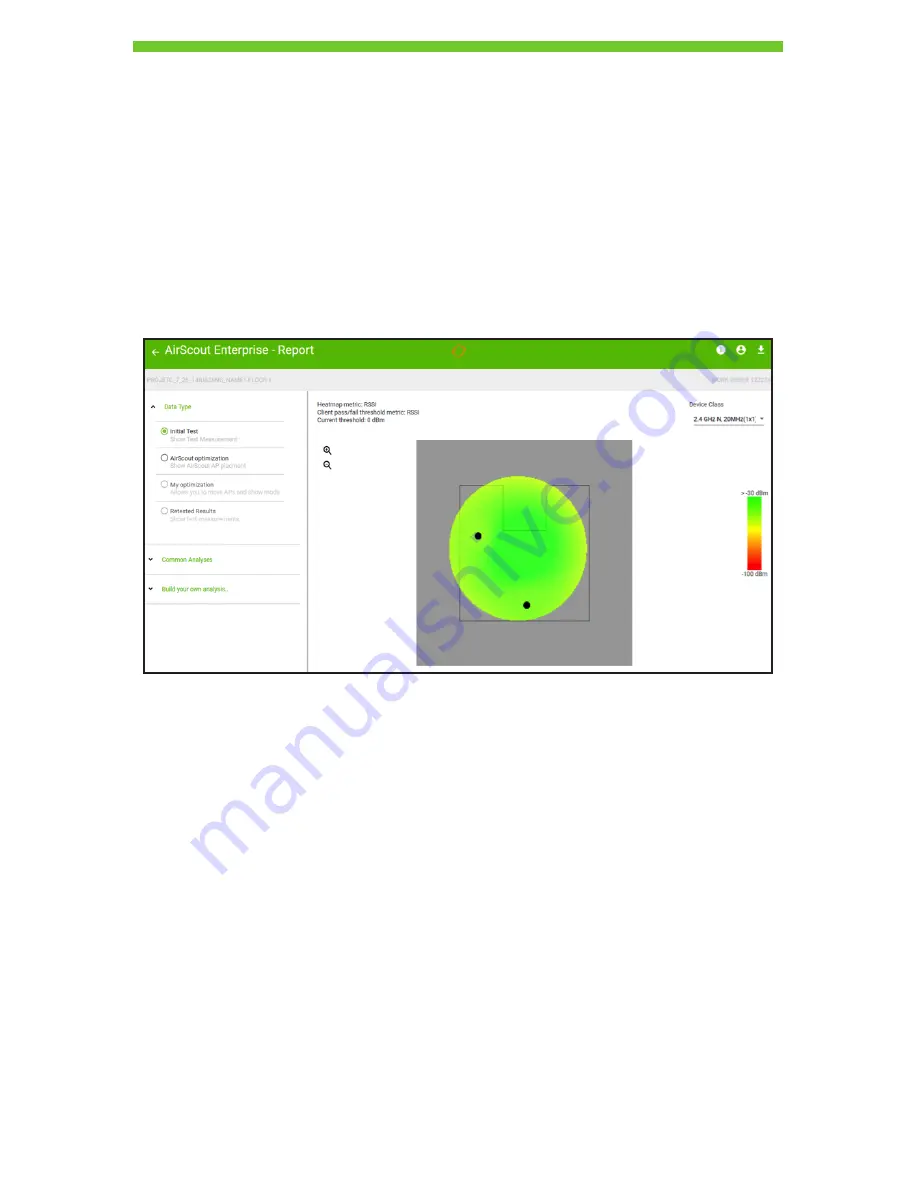
The report view within the application provides a single view where performance metrics
can be analyzed. Upon finishing a test, this view launches with a heatmap showing signal
strength at the center of the page.
Because AirScout analyzes many different types of devices in both bands, a Device Class
dropdown selector appears at the top right side to view performance metrics relevant to
the different device types.
AirScout has the ability to draw dynamic heatmaps based on metrics such as signal
strength, throughput, and latency. A legend for the current heatmap metric is shown on the
right side. On the left side, menus for Data Type and Build Your Own Analysis are shown.
Heatmap Metrics and Pass/Fail Criteria
Heatmaps are drawn based on the selected metric within the “Build Your Own Analysis”
tab. In the upper left corner of the heatmap area the user can see information related to
the current heatmap metric shown. In addition, the analysis engine provides a method to
define pass/fail criteria for individual client measurements. This pass/fail criteria can be set
independently of the heatmap metric, providing a rich multidimensional view.
In the heatmap view area, the upper left side contains information on the heatmap metric
and the client pass/fail threshold metric, with the current threshold for pass/fail shown.
Heatmap metric: RSSI
Client pass/fail threshold metric: RSSI
Current threshold: 0 dBm
DRAFT #2—11.16.16


