


128
2.18 Event Chart
Dispatch Server can display log data in line chart, bar chart or pie chart.
To display the Event Chart, you need to install the following software on the
computer. Use the links in the software DVD or click
Here
below to
download the software.
z
Microsoft .NET Framework 3.5 SP1 or later versions (Click
Here
)
z
Microsoft Chart Controls (Click
Here
)
To access the Event Chart:
1. Click
View
from the menu bar and select
Dispatchlog
.
2. Click
the
Event Chart
button
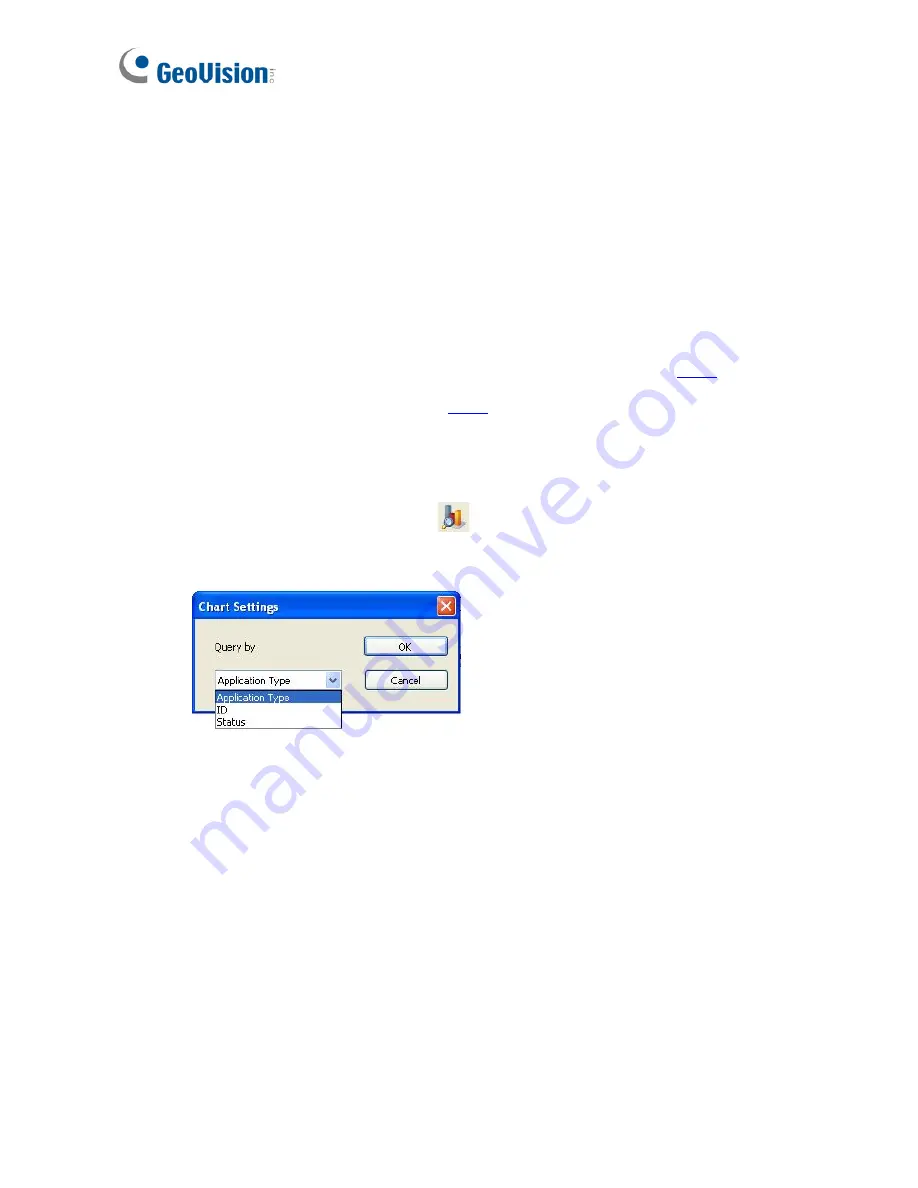
on the Dispatch Log Browser. This
dialog box appears.
Figure 2-14
3.
From the drop-down list, select
Application Type
to display events by
the type of server,
ID
to display events by ID or
Status
to display
events by the type of status. Application Type includes Dispatch Server,
Center V2 Server, and Center V2 Subscribers. When Status is
selected, events are categorized into Account, System, Login/logout,
Connection, Control and Dispatch.
Содержание GV-CMS Series
Страница 1: ...CSV8530 A User s Manual V8 5 3 User s Manual V8 5 3 GV CMS Series ...
Страница 10: ...viii ...
Страница 253: ...242 Figure 4 53 ...
Страница 311: ...300 3 Click the Exceptions tab This dialog box appears Figure G 3 4 Select UPnP Framework and click OK ...


