


29
15.2 Uploading and saving logs
To retrieve data from the dashboard memory, click the “
Get Log”
box at the top of the data logging
window. A progress bar will appear in the centre of the screen during data retrieval. Upon completion, a
window will open allowing the user to specify the car and event name. There is also a field where you may
add notes to the log file. Click ‘Save’ to specify a log file name and save location.
After the log file is saved to disk, you will be asked if you want to clear the data from the dashboard, after
which the Dashview software will automatically open to display the logged data.
15.3 Dashview data analysis
The Geartronics Dashview software is a user-friendly data analysis application that is fundamental to
helping engineers identify and diagnose problems, and to help drivers extract maximum performance from
their vehicles. Whilst is might not have advanced features that are often found in more expensive analysis
packages, it does provide sufficient functionality to satisfy most needs.
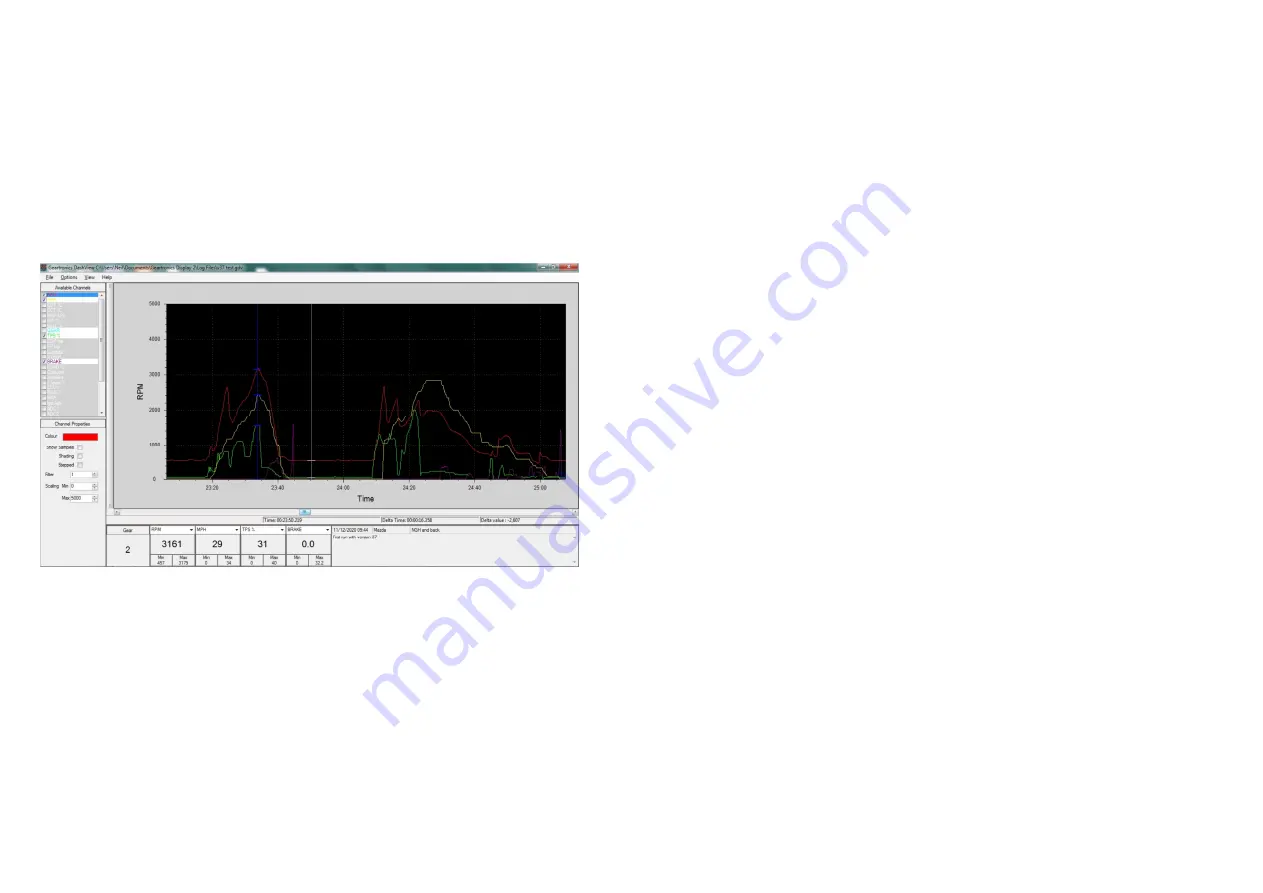
The Dashview software is split into 5 main areas:
1. The central window displays the data graph where selected data channels are overlaid on top of
each other. The background colour of the graph can be changed from the options menu at the top
of the screen, as can the toggling of grid lines on the graph. Directly under the graph there is a time
value that shows the time from the beginning of the log to the current cursor position. A
graph
marker
can be placed at any point along the time axis in order to measure the exact channel values
at that point. To do this, click the cursor on the desired point on the graph and a vertical blue line will
appear. Subsequently moving the cursor away from the marker will allow you to measure the time
difference (delta) and the highlighted channel value delta between the two points.
2. To the left of the main data window you will find a list of all dashboard channels. Any channel that is
displayed on a white background is available to view by clicking on the box to the left of the channel
name. This will add the channel to the graph. Channels that are greyed out are not present in the
log file and are therefore not available to view.
30
3. Below the channel list you will find the properties for the channel currently highlighted. From here
you can change the following properties:
•
Colour
– select the trace colour from the standard Windows palette
•
Scaling Min
- minimum displayed value
•
Scaling Max
– maximum displayed value
•
Filter
- used for smoothing a ‘noisy’ trace
•
Show Samples
- changes the trace from an interpolated line to individual samples
•
Shading
- fills in the area under the trace with the channel colour (transparent)
•
Stepped
– This affects how the sample points are joined up and viewed on the graph. Channels
that have a range of discreet values (such as the gear number) will look better when stepped
4. Beneath the graph window, and to the left, there are 5 boxes that display the current channel value
at the point where the graph marker is placed. The first box always shows the gear number, but the
channels in the remaining 4 boxes may be selected from the pull-down menu by clicking the arrow
in the top right corner of the box. In addition to the current cursor value, each box contains the
minimum and maximum channel value across the current zoomed graph.
5. Beneath the graph window, and to the right, is the log file information field. This includes the date of
the log, the vehicle name, event name and any comments that were added at the time of saving the
log to disk.
15.4 Dashview keyboard functions and shortcuts
The software can be used on both laptop PC’s using the built-in touchpad, or on a desktop PC using a
scroll mouse. In addition to the mouse functions there are several keyboard functions and shortcuts that
must be learned. These are as follows:
•
Up cursor
– zooms in around the graph marker position
•
Down cursor
– zooms out around the graph marker position
•
F2
– resets the zoom to include the entire data log within the graph window
•
Left cursor
– moves the graph marker to the left (fine)
•
Right cursor
- moves the graph marker to the right (fine)
•
Crtl+Left cursor
– moves the graph marker to the left (coarse)
•
Crtl+right cursor
– moves the graph marker to the right (coarse)
•
Shift+Left cursor
– pans the graph to the left
•
Shift+Right cursor
– pans the graph to the right
•
Ctrl+shift+C
– toggles the channel list window to maximise the graph viewing area
•
Ctrl+G
– toggles grid lines on the graph
•
S
– displays individual data samples for all channels
•
Ctrl+S
– displays individual data samples for the highlighted channel
•
Ctrl+P
– print the current graph view
•
Ctrl+C
– copies the current graph view to the clipboard
•
Ctrl+O
– Open a data file
•
Mouse scroll
– Zooms in and out
In addition to the key functions listed above, right-clicking anywhere within the graph window allows users
to quickly print the current graph window, save the graph image to the clipboard or save the graph as an
image to a specified location.


