background image

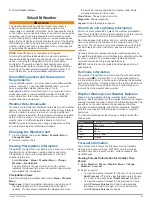
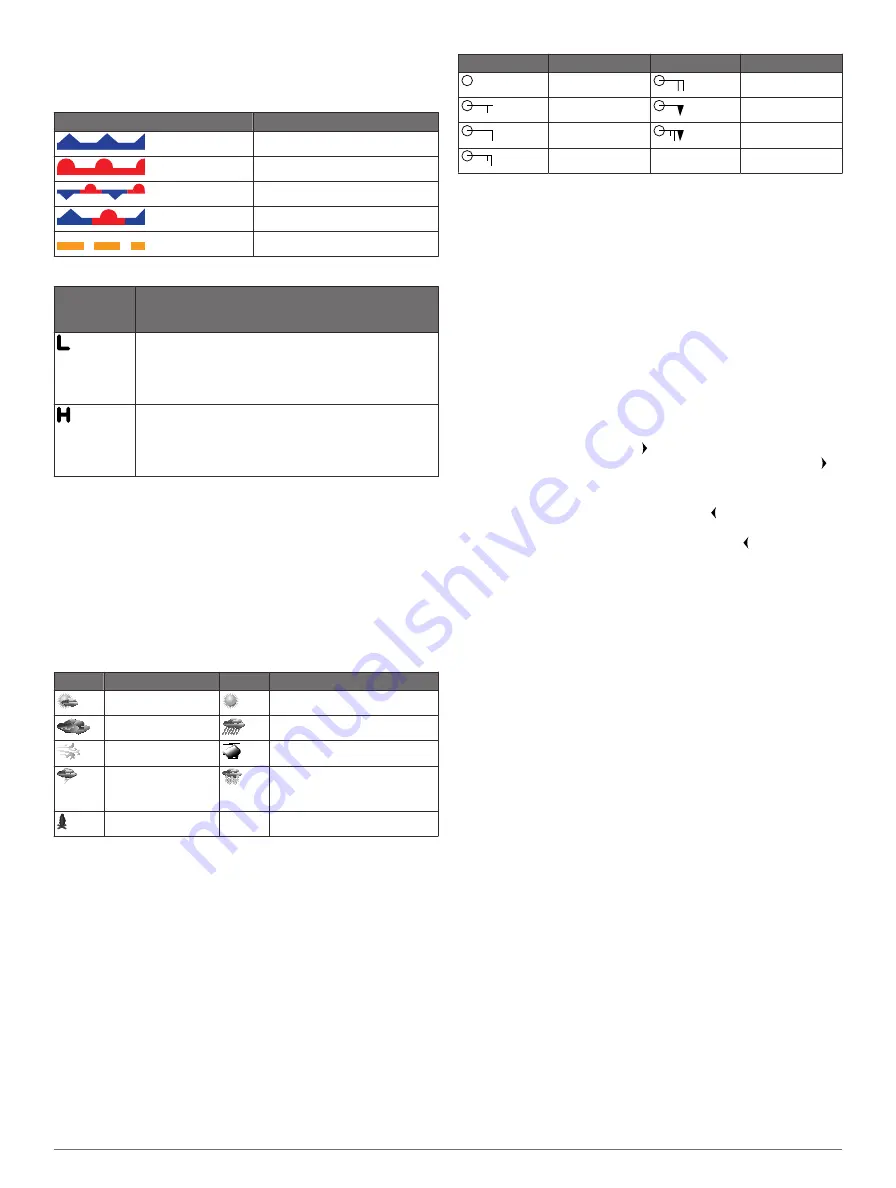
Weather Fronts and Pressure Centers

Weather fronts appear as lines that indicate the leading edge of 

an air mass.

Front Symbol

Description

Cold front

Warm front

Stationary front

Occluded front

Trough

Pressure-center symbols often appear near weather fronts.

Pressure-
Center 
Symbol

Description

Indicates a low-pressure center, which is a region of 
relatively lower pressure. Moving away from a low-
pressure center results in increased pressure. Winds 
flow counterclockwise around low-pressure centers in 
the northern hemisphere.
Indicates a high-pressure center, which is a region of 
relatively higher pressure. Moving away from a high-
pressure center results in decreased pressure. Winds 
flow clockwise around high-pressure centers in the 
northern hemisphere.

Viewing a Marine Forecast or an Offshore Forecast

1

Select 

Weather

 > 

Menu

 > 

Weather Menu

 > 

Change 

Weather

 > 

Forecast

.

2

Pan the chart to an offshore location.
The Marine Forecast or Offshore Forecast options appear 

when forecast information is available.

3

Select 

Marine Forecast

 or 

Offshore Forecast

.

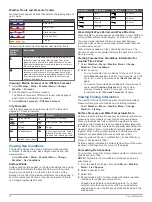
City Forecasts

City forecasts appear as weather symbols. The forecast is 

viewed in 12-hour increments.

Symbol Weather

Symbol Weather

Partly cloudy

Fair (sunny, hot, clear)

Cloudy

Rain (drizzle, sleet, showers)

Windy

Foggy

Thunderstorms

Snow (snow showers, flurries, 
blizzard, blowing snow, sleet, 
freezing rain, freezing drizzle)

Smoke (dusty, hazy)

Viewing Sea Conditions

The Sea Conditions chart shows information about surface 

conditions, including winds, wave height, wave period, and 

wave direction.

Select 

Weather

 > 

Menu

 > 

Weather Menu

 > 

Change 

Weather

 > 

Sea Conditions

.

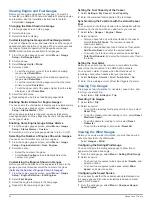
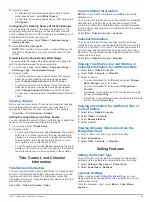
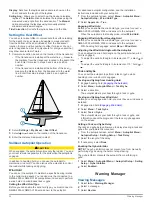
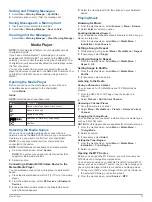
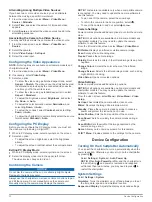
Surface Winds

Surface wind vectors appear on the Sea Conditions chart using 

wind barbs that indicate the direction from which the wind is 

blowing. A wind barb is a circle with a tail. The line or flag 

attached to the tail of the wind barb indicates the wind speed. A 

short line represents 5 knots, a long line represents 10 knots, 

and triangle represents 50 knots.

Wind Barb

Wind Speed

Wind Barb

Wind Speed

Calm

20 knots

5 knots

50 knots

10 knots

65 knots

15 knots

Wave Height, Wave Period, and Wave Direction

Wave heights for an area appear as variations in color. Different 

colors indicate different wave heights, as shown in the legend.
The wave period indicates the time (in seconds) between 

successive waves. Wave period lines indicate areas that have 

the same wave period.
Wave directions appear on the chart using red arrows. The 

direction of each arrow pointer indicates the direction in which a 

wave is moving.

Viewing Forecast Sea Conditions Information for 

Another Time Period

1

Select 

Weather

 > 

Menu

 > 

Weather Menu

 > 

Change 

Weather

 > 

Sea Conditions

.

2

Select an option:
• To view forecasted sea conditions for the next 12 hours, 

select 

Next Forecast

 or  , and to view forecasts, up to 36 

hours, in 12-hour increments, select 

Next Forecast

 or 

again.

• To view the forecasted sea conditions for the previous 12 

hours, select 

Previous Forecast

 or  , and to view 

previous forecasts, up to 36 hours ago, in 12-hour 

increments, select 

Previous Forecast

 or   again.

Viewing Fishing Information

The weather Fishing chart shows present water temperature, 

present surface pressure conditions, and fishing forecasts.

Select 

Weather

 > 

Menu

 > 

Weather Menu

 > 

Change 

Weather

 > 

Fishing

.

Surface Pressure and Water Temperature Data

Surface-pressure information appears as pressure isobars and 

pressure centers. Isobars connect points of equal pressure. 

Pressure readings can help to determine weather and wind 

conditions. High-pressure areas are generally associated with 

fair weather. Low-pressure areas are generally associated with 

clouds and the chance of precipitation. Isobars packed closely 

together show a strong pressure gradient. Strong pressure 

gradients are associated with areas of stronger winds.
Pressure units are shown in millibars (mb), inches of Mercury 

(inHg), or hectopascals (hPa).
Colored shading indicates the surface temperature of the water, 

as shown in the legend in the corner of the display.

Forecasting Fish Locations

You can show areas that contain optimal weather conditions for 

specific species of fish.

NOTE: 

This feature is not available on all devices and in all 

subscriptions.

1

From the weather Fishing chart, select 

Menu

 > 

Weather 

Menu

 > 

Fish Species

.

2

Select a species of fish.

3

Select 

On

.

4

Repeat steps 2 and 3 to show areas with optimal weather 

conditions for additional species of fish.
Shaded areas indicate optimal fishing areas. If you have 

selected more than one species of fish, you can select a 

shaded area to view the fish species that are included in the 

shaded area.

30

SiriusXM Weather

Содержание GPSMAP 8000 Glass Helm Series

Страница 1: ...GPSMAP 8000 Glass Helm Series Owner s Manual June 2014 190 01557 00_0C Printed in Taiwan...

Страница 2: ...Shadow Drive are trademarks of Garmin Ltd or its subsidiaries These trademarks may not be used without the express permission of Garmin Android is a trademark of Google Inc The Bluetooth word mark is...

Страница 3: ...aypoints 7 Marking Your Present Location as a Waypoint 7 Creating a Waypoint at a Different Location 7 Marking an SOS Location 7 Viewing a List of all Waypoints 8 Editing a Saved Waypoint 8 Moving a S...

Страница 4: ...eading with the Helm 20 Adjusting the Heading with the Chartplotter in Step Steering Mode 20 Adjusting the Heading with the Chartplotter in Rudder Steering Mode 20 Autopilot Settings 20 Selecting the...

Страница 5: ...e Channel Guide 28 Saving a SiriusXM Channel to the Presets List 28 Adjusting SiriusXM Satellite Radio Volume 28 Unlocking SiriusXM Parental Controls 28 Setting Parental Controls on SiriusXM Radio Cha...

Страница 6: ...emory Card 36 Copying Waypoints Routes and Tracks to a Memory Card 36 Copying Waypoints Routes and Tracks to or from all Chartplotters on the Network 36 Copying Built In Maps to a Memory Card 36 Backi...

Страница 7: ...optional memory cards in the chartplotter Map cards allow you to view high resolution satellite imagery and aerial reference photos of ports harbors marinas and other points of interest You can use bl...

Страница 8: ...and install the application and connect the chartplotter to a Wi Fi router 1 Select Settings Communications Wireless Devices Helm App 2 Select an option 3 Use the application to view or control the c...

Страница 9: ...include depth contour lines intertidal zones spot soundings as depicted on the original paper chart navigational aids and symbols obstructions and cable areas Showing a Different Chart 1 From a chart...

Страница 10: ...some areas 1 From the Navigation chart or Fishing chart select a tide station Tide direction and tide level information appear near 2 Select an option to view additional station information Select th...

Страница 11: ...angerous target and the numbers near the symbol indicate the time to the closest point of approach to that target NOTE Vessels being tracked with the Blue Force Tracking feature are indicated with a b...

Страница 12: ...Settings Alarms AIS 2 Select an option To receive or ignore Emergency Position Indicating Radio Beacon EPRIB test signals select AIS EPIRB Test To receive or ignore Man Overboard MOB test signals sele...

Страница 13: ...s Eye 3D NOTE This setting affects only the appearance of hazard colors in Mariner s Eye 3D It does not affect the safe water depth Auto Guidance setting or the sonar shallow water alarm setting Rang...

Страница 14: ...art of the Auto Guidance line This is due to the settings for minimum safe water depth and minimum safe obstacle height 6 Follow the magenta line steering to avoid land shallow water and other obstacl...

Страница 15: ...ation The corrected course is dynamic and it moves with your boat when you are off course 7 Review the course indicated by the magenta line 8 Follow the magenta line along each leg in the route steeri...

Страница 16: ...ot system a dedicated autopilot control display must be installed at each steering helm in order to disable the autopilot system The Auto Guidance feature is based on electronic chart information That...

Страница 17: ...rmin autopilot connected to the chartplotter using NMEA 2000 the autopilot follows the Auto Guidance route Setting and Following a Direct Course Using Go To CAUTION When using Go To a direct course an...

Страница 18: ...eam The DownV scanning sonar technology emits a narrow beam similar to the shape of the beam in a copying machine This beam provides a clearer picture like image of what is beneath the boat SideV Sona...

Страница 19: ...gain for traditional transducers or by adjusting the brightness for DownV and SideV DownV transducers If you want to see the highest intensity signal returns on the screen you can lower the gain or b...

Страница 20: ...frequency you should consider your goals and water conditions when using Chirp Some sonar black boxes and transducers also provide the ability to customize preset frequencies for each transducer elem...

Страница 21: ...stance to the right and left of the boat Available for SideV sonar view Sonar Alarm Settings NOTE Some settings require external accessories Select Settings Alarms Sonar Shallow Water Sets an alarm to...

Страница 22: ...isplay Modes NOTE Not all modes are available with all radar devices and all chartplotters Select Radar Menu Radar Menu Change Radar and select a mode Cruising Mode Shows a full screen image of the ga...

Страница 23: ...djust Guard Zone Adjust Guard Zone Corner 1 2 Touch and drag the location of the outer guard zone corner 3 Select Corner 2 4 Touch the location of the inner guard zone corner to define the width of th...

Страница 24: ...Navigation chart or the Fishing chart Data appears on the Radar overlay based on the most recently used radar mode such as Harbor Offshore or Sentry and all settings configurations applied to the Rad...

Страница 25: ...ar in use the sea clutter setting configured for use in one radar mode may or may not be applied to other radar modes or to the radar overlay NOTE Not all options and settings are available on all rad...

Страница 26: ...ny screen select Engage Your intended heading shows in the center of the Autopilot screen Adjusting the Heading with the Helm NOTE You must enable the Shadow Drive feature before you can adjust the he...

Страница 27: ...g the Williamson Turn Pattern You can use the Williamson turn pattern to steer the boat around with the intent of running alongside the location where the Williamson turn pattern was initiated The Wil...

Страница 28: ...alling Networked Chartplotter and VHF Radio Functionality If you have a NMEA 0183 VHF radio or a NMEA 2000 VHF radio connected to your chartplotter these features are enabled The chartplotter can tran...

Страница 29: ...select Trail To select a color for the trail line select Trail Line Deleting a Position Report Call 1 Select Info DSC List 2 Select a position report call 3 Select Review Clear Report Viewing Vessel T...

Страница 30: ...tup Engine Selection Edit Engines 2 Select First Engine 3 Select the engine to display in the first gauge 4 Repeat for the remaining engine bars Setting the Fuel Capacity of the Vessel 1 Select Settin...

Страница 31: ...You can view information about a tide station for a specific date and time including the tide height and when the next high and low tides will occur By default the chartplotter shows tide information...

Страница 32: ...nd sensor to the autopilot For advanced autopilot configuration see the installation instructions included with your autopilot 1 From the autopilot screen select Menu Autopilot Menu Autopilot Setup Wi...

Страница 33: ...media player 2 From the media screen select BT Devices or Bluetooth Devices 3 Enable the Discoverable mode on the Bluetooth device A list of devices appears 4 Select the media player from the options...

Страница 34: ...to care siriusxm com refresh or contact SiriusXM by phone at 1 855 MYREFRESH 697 3373 NOTE For the SiriusXM Connect Tuner to receive the activation message it must be powered on and receiving the Sir...

Страница 35: ...art select Menu Weather Menu Radar Loop Shows precipitation information as an image of the latest update or as an animated loop of the latest updates The time stamp indicates the elapsed time since th...

Страница 36: ...te different wave heights as shown in the legend The wave period indicates the time in seconds between successive waves Wave period lines indicate areas that have the same wave period Wave directions...

Страница 37: ...tric pressure information select Sea Surface To view wind and wave information select Marine Bulletin Creating a Waypoint on a Weather Chart 1 From a weather chart select a location 2 Select Create Wa...

Страница 38: ...camera NOTE This feature is available only when a compatible camera is connected You may need to update the camera software to use this feature To pan and tilt the camera select the arrow keys To ret...

Страница 39: ...ute You can set the transition to be based on time or distance before the turn You can increase the time or distance value to help improve the accuracy of the autopilot when navigating a route or an A...

Страница 40: ...MEA 0183 Output Sentences Posn Precision Adjusts the number of digits to the right of the decimal point for transmission of NMEA output XTE Precision Adjusts the number of digits to the right of the d...

Страница 41: ...ure the distance from the transducer to the water line Enter this value in steps 3 and 4 as a negative number 2 Select Settings My Vessel Keel Offset 3 Select or based on the location of the transduce...

Страница 42: ...rs on the Network You can transfer information for waypoints routes and tracks from one chartplotter connected to the Garmin Marine Network to every other chartplotter connected to the network The tra...

Страница 43: ...nna make sure the antenna is connected to the chartplotter or the NMEA network If the device has more than one GPS antenna source select a different source Selecting the GPS Source My device will not...

Страница 44: ...arameters Dynamic 127505 Fluid level 128259 Speed water referenced 128267 Water depth 129025 Position rapid update 129038 AIS class A position report 129039 AIS class B position report 129040 AIS clas...

Страница 45: ...sting 18 measuring 18 showing 18 engine gauges 24 configuring 24 status alarms 24 EPIRB 6 event log 33 F factory settings 36 stations 2 Fish Eye 3D sonar cone 7 suspended targets 7 tracks 7 fishing ch...

Страница 46: ...SideV 12 source 13 surface noise 15 suspended targets 15 views 12 13 waypoint 12 whiteline 15 zoom 13 SOS 7 23 stations 2 changing the station 33 customizing the home screen of 2 ordering the display...

Страница 47: ......
Страница 48: ...699699 52 001 855 792 7671 0800 0233937 47 815 69 555 00800 4412 454 44 2380 662 915 35 1214 447 460 386 4 27 92 500 0861 GARMIN 427 646 27 0 11 251 9999 34 93 275 44 97 46 7744 52020 886 2 2642 9199...

Отзывы: