background image

• To receive or ignore Search and Rescue Transponder 

(SART) test signals, select 

AIS-SART Test

.

Turning Off AIS Reception

AIS signal reception is turned on by default.

Select 

Settings

 > 

Other Vessels

 > 

AIS

 > 

Off

.

All AIS functionality on all charts and 3D chart views is 

disabled. This includes AIS vessel targeting and tracking, 

collision alarms that result from AIS vessel targeting and 

tracking, and the display of information about AIS vessels.

Chart View Settings

NOTE: 

Not all settings apply to all chart views. Some options 

require premium maps or connected accessories.
These settings apply to the chart views, except Fish Eye 3D 

(

Fish Eye 3D Settings

, page 10

).

From a chart view, select MENU.

Layers

: Adjusts the appearance of the different items on the 

charts (

Chart Layers

, page 9

).

Waypoints & Tracks

: Adjusts how waypoints and tracks are 

shown (

User Data Layer Settings

, page 9

).

Quickdraw Contours

: Turns on bottom contour drawing, and 

allows you to create fishing map labels (

Garmin Quickdraw 

Contours Mapping

, page 10

).

Chart Setup

: Adjusts the orientation and level of detail shown 

on the chart and adjusts the data shown on the screen.

Chart Layers

you can turn on and off chart layers and customize features of 

the charts. Each setting is specific to the chart or chart view 

being used.

NOTE: 

Not all settings apply to all charts and chartplotter 

models. Some options require premium maps or connected 

accessories.
From a chart, select 

MENU

 > 

Layers

.

Chart

: Shows and hides chart-related items (

Chart Layer 

Settings

, page 9

).

My Vessel

: Shows and hides items relating to the boat (

My 

Vessel Layer Settings

, page 9

).

User Data

: Shows and hides user data, such as waypoints, 

boundaries, and tracks, and opens user data lists (

User Data 

Layer Settings

, page 9

).

Other Vessels

: Adjusts how other vessels are shown (

Other 

Vessels Layer Settings

, page 10

).

Water

: Shows and hides depth items (

Water Layer Settings

page 10

).

Quickdraw Contours

: Shows and hides Garmin Quickdraw 

Contours data (

Garmin Quickdraw Contours Settings

page 12

).

Chart Layer Settings

From a chart, select 

MENU

 > 

Layers

 > 

Chart

.

Satellite Photos

: Shows high-resolution satellite images on the 

land or on both land and sea portions of the Navigation chart, 

when certain premium maps are used (

Showing Satellite 

Imagery on the Navigation Chart

, page 7

).

NOTE: 

This setting must be enabled to view Standard 

Mapping charts.

Tides & Currents

: Shows current station indicators and tide 

station indicators on the chart and enables the tides and 

current slider, which sets the time for which tides and 

currents are reported on the map.

Land POIs

: Shows points of interest on land.

Navaid

: Shows navigational aids, such as ATONs and flashing 

lights, on the chart. Allows you to select NOAA or IALA 

navaid type.

Service Points

: Shows locations for marine services.

Depth

: Adjusts the items on the depth layer (

Water Layer 

Settings

, page 10

).

Restricted Areas

: Shows information about restricted areas on 

the chart.

Photo Points

: Shows camera icons for aerial photos (

Viewing 

Aerial Photos of Landmarks

, page 7

).

My Vessel Layer Settings

From a chart, select 

MENU

 > 

Layers

 > 

My Vessel

.

Heading Line

: Shows and adjusts the heading line, which is a 

line drawn on the map from the bow of the boat in the 

direction of travel (

Setting the Heading Line and Angle 

Markers

, page 6

).

Laylines

: Adjusts the laylines, when in sailing mode (

Laylines 

Settings

, page 9

).

Roses

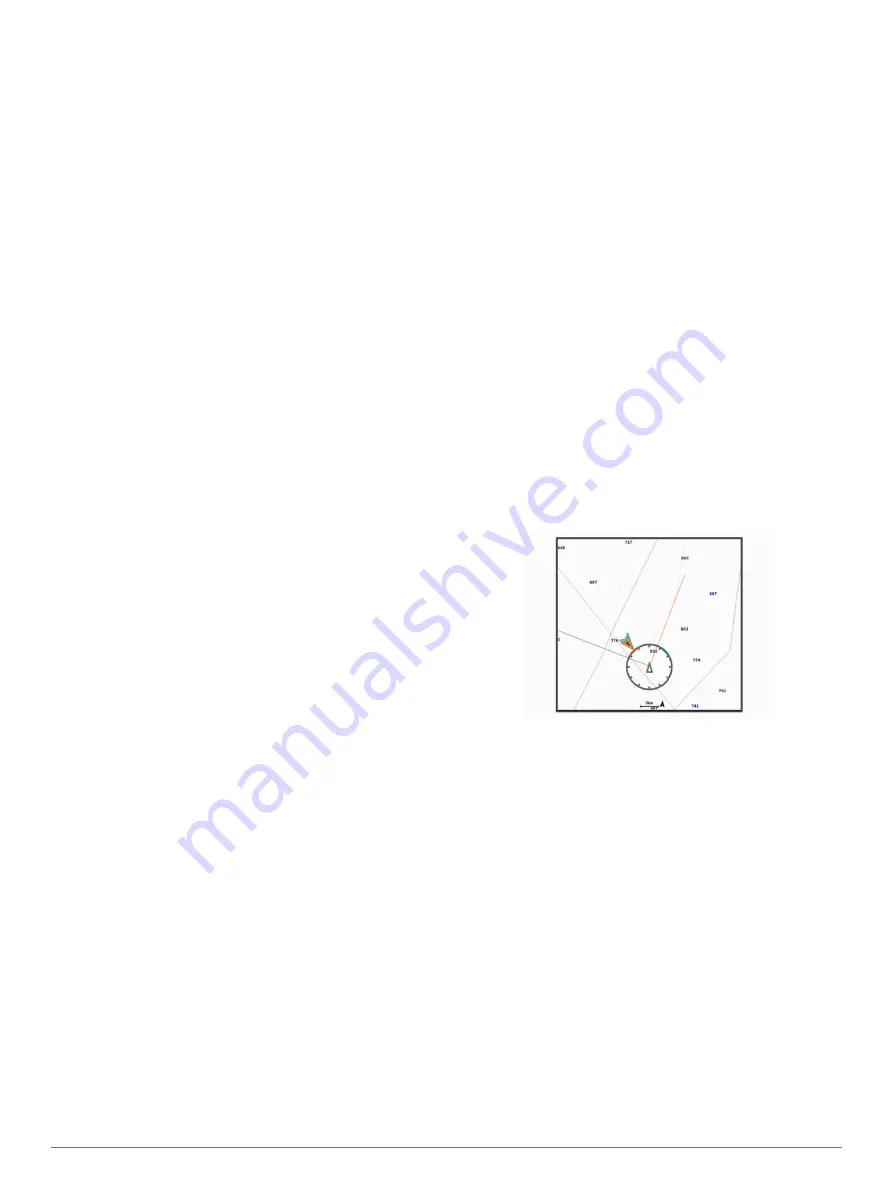
: Allows you to display roses on the chart. Wind roses 

show a visual representation of the wind angle or direction 

provided by the connected wind sensor. The compass rose 

indicates the compass direction oriented to the heading of the 

boat.

Vessel Icon

: Sets the icon that represents your present location 

on the chart.

Laylines Settings

To use the laylines features, you must connect a wind sensor to 

the chartplotter.
When in sailing mode (

Setting the Vessel Type

, page 3

), you 

can display laylines on the navigation chart. Laylines can be 

very helpful when racing.

From the navigation chart, select 

MENU

 > 

Layers

 > 

My Vessel 

Laylines

 > 

Setup

.

Display

: Sets how the laylines and vessel appear on the chart, 

and sets the length of the laylines.

Sailing Angle

: Allows you to select how the device calculates 

laylines. The Actual option calculates the laylines using the 

measured wind angle from the wind sensor. The Manual 

option calculates the laylines using manually entered 

windward and leeward angles.

Windward Angle

: Allows you to set a layline based on the 

windward sailing angle.

Leeward Angle

: Allows you to set a layline based on the 

leeward sailing angle.

Tide Correction

: Corrects the laylines based on the tide.

Filter Time Constant

: Filters the layline data based on the time 

interval entered. For a smoother layline that filters out some 

of the changes in the boat's heading or true wind angle, enter 

a higher number. For laylines that display a higher sensitivity 

to changes in the boat's heading or true wind angle, enter a 

lower number.

User Data Layer Settings

You can show user data, such as waypoints, boundaries, and 

tracks, on the charts.
From a chart, select 

MENU

 > 

Layers

 > 

User Data

.

Charts and 3D Chart Views

9

Содержание Echomap Plus 40 series

Страница 1: ...ECHOMAP PLUS40 60 70 90SERIES Owner sManual...

Страница 2: ...r countries ActiveCaptain ECHOMAP FUSION Link Garmin ClearV Garmin Connect Garmin Express Garmin Quickdraw GXM HomePort LiveScope OneChart and Panoptix are trademarks of Garmin Ltd or its subsidiaries...

Страница 3: ...ng the Garmin Quickdraw Contours Feature 11 Adding a Label to a Garmin Quickdraw Contours Map 11 Garmin Quickdraw Community 11 Connecting to the Garmin Quickdraw Community with ActiveCaptain 11 Connec...

Страница 4: ...Pattern 26 Following the Williamson Turn Pattern 27 Reactor Autopilot Remote Control 27 Pairing a Reactor Autopilot Remote Control With a Chartplotter 27 Changing the Functions of the Reactor Autopilo...

Страница 5: ...el 36 Customizing Engine Gauge and Fuel Gauge Limits 36 Communications Settings 36 NMEA 0183 36 NMEA 2000 Settings 36 Wi Fi Network 37 Setting Alarms 37 Navigation Alarms 37 System Alarms 37 Setting t...

Страница 6: ......

Страница 7: ...MENU Opens a menu of options for the page when applicable Closes a menu when applicable Takes a screenshot when held ECHOMAP Plus 60 Front View Power key Automatic backlight sensor Keys microSD memor...

Страница 8: ...ping record sonar with a compatible transducer transfer data such as waypoints and routes to another compatible chartplotter or a computer and use the ActiveCaptain app This device supports up to a 32...

Страница 9: ...m any screen press repeatedly to scroll through the brightness levels This can be helpful when the brightness is so low you cannot see the screen Adjusting the Color Mode 1 Select Settings System Disp...

Страница 10: ...ns you receive in your mobile device settings Updating Software with the ActiveCaptain App If your device has Wi Fi technology you can use the ActiveCaptain app to download and install the latest soft...

Страница 11: ...ead two fingers apart on the touchscreen Panning the Chart with the Keys You can move the chart to view an area other than your present location 1 From the chart use the arrow keys 2 Select BACK to st...

Страница 12: ...lect Time Time and enter the time used to calculate the distance your boat will travel in the specified time at your present speed Turning on Angle Markers You can add angle markers to the map along t...

Страница 13: ...hat has elapsed since the last position of the vessel was reported nearest approach and time to the nearest approach Some chartplotter models also support Blue Force Tracking Vessels being tracked wit...

Страница 14: ...and their identifying and location information is sent from another location Virtual ATONs do not actually exist and their identifying and location information is sent from another location You can v...

Страница 15: ...chart and enables the tides and current slider which sets the time for which tides and currents are reported on the map Land POIs Shows points of interest on land Navaid Shows navigational aids such a...

Страница 16: ...5 to 10 ft Yellow From 3 to 4 5 m from 10 to 15 ft Green From 4 5 to 7 6 m from 15 to 25 ft Fish Eye 3D Settings NOTE This feature is available with premium charts in some areas From the Fish Eye 3D c...

Страница 17: ...to the device automatically Sharing Your Garmin Quickdraw Contours Maps with the Garmin Quickdraw Community Using ActiveCaptain You can share Garmin Quickdraw Contours maps that you have created with...

Страница 18: ...em a dedicated autopilot control display must be installed at each steering helm in order to disable the autopilot system NOTE Some chart views are available with premium charts in some areas To navig...

Страница 19: ...ocation as a Waypoint From any screen select MARK Creating a Waypoint at a Different Location 1 Select Nav Info Waypoints New Waypoint 2 Select an option To create the waypoint by entering position co...

Страница 20: ...enta line steering to avoid land shallow water and other obstacles Creating and Saving a Route This procedure saves the route and all the waypoints in it The starting point can be your present locatio...

Страница 21: ...a line steering to avoid land shallow water and other obstacles NOTE When using Auto Guidance a gray segment within any part of the magenta line indicates that Auto Guidance cannot calculate part of t...

Страница 22: ...p Navigation and proceed to step 10 If the Auto Guidance line is too close to known obstacles select Settings Navigation Auto Guidance Shoreline Distance Farthest If the turns in the Auto Guidance lin...

Страница 23: ...t as the active boundary You can add the active boundary data to the data fields on the chart Creating a Boundary 1 Select Nav Info Boundaries New 2 Select a boundary shape 3 Follow the on screen inst...

Страница 24: ...nt frequencies NOTE The split frequency sonar view requires the use of a dual frequency transducer Split Zoom Sonar View The split zoom sonar view shows a full view graph of sonar readings and a magni...

Страница 25: ...views To access the Panoptix sonar views select Sonar and select a view LiveV Down Sonar View This sonar view shows a two dimensional view of what is below the boat and can be used to see a bait ball...

Страница 26: ...ring Sonar information flashes on the ring when it is received at the depth indicated The flasher colors indicate different strengths of the sonar return The default color scheme follows a traditiona...

Страница 27: ...Waypoint or SELECT 4 If necessary edit the waypoint information such as the waypoint name Pausing the Sonar Display From a sonar view select MENU Pause Sonar Measuring Distance on the Sonar Screen You...

Страница 28: ...ows the vertical lines indicating the distance to the right and left of the boat This setting is available for SideV sonar view Color Scheme Sets the color scheme of the sonar view This setting might...

Страница 29: ...be used to remove interference from the screen Correcting installation issues that cause noise is the best way to eliminate interference Surface Noise Hides surface noise to help reduce clutter Wider...

Страница 30: ...owly NOTE This feature is not available for the RealV 3D Historical sonar view 1 From a RealV sonar view select MENU Sweep Speed 2 Select an option LiveV Forward and FrontV Sonar Menu From the LiveV F...

Страница 31: ...Panoptix transducer is mounted Entering the actual depth at which the transducer is mounted results in a more accurate visual presentation of what is in the water Bow Offset Sets the distance between...

Страница 32: ...ource NOTICE For best results use the autopilot CCU internal compass for the heading source Using a third party GPS compass can cause the data to be delivered erratically and may result in excessive d...

Страница 33: ...tarting Line Guidance Sailing start line guidance is a visual representation of the information you need to cross the start line at the optimal time and speed After you set the starboard and port star...

Страница 34: ...at the water line or anywhere above the end of the keel measure the distance from the transducer location to the keel of the boat Enter this value as a positive number If the transducer is installed...

Страница 35: ...and Fuel Gauges Before you can view engine and fuel gauges you must be connected to a NMEA 2000 network capable of sensing engine and fuel data See the installation instructions for details Select Ga...

Страница 36: ...nd gauge appears select Change Downwind Scale and set the angles To view true or apparent wind select Wind and select an option Tide Current and Celestial Information Tide Station Information You can...

Страница 37: ...igate To 4 Select Go To or Route To Creating a Waypoint at the Position of a Tracked Vessel 1 Select Nav Info Other Vessels DSC List 2 Select a position report call 3 Select Create Waypoint Editing In...

Страница 38: ...search feature to find a song or album in a large list From the media screen select MENU Installation Alpha Search Setting a Song to Repeat 1 While playing a song select MENU Repeat 2 If necessary se...

Страница 39: ...list 3 Select a station from the list DAB Presets You can save your favorite DAB stations as presets for easy access You can save up to 15 DAB station presets Saving a DAB Station as a Preset 1 From...

Страница 40: ...nd instructions are available on your device product page 2 Insert the USB flash drive into the USB port of the stereo 3 On the chartplotter media screen select MENU Installation Update Software 4 Sel...

Страница 41: ...sselSynchronizing the Fuel Data with the Actual Vessel Fuel page 29 Set Gauge Limits Sets the upper and lower limits of various gauges Customizing Engine Gauge and Fuel Gauge Limits page 36 Setting th...

Страница 42: ...sentences the chartplotter transmits how many digits to the right of the decimal point are transmitted in a NMEA output and how waypoints are identified NMEA 0183 Settings page 36 NMEA 2000 Setup All...

Страница 43: ...irection references used in calculating heading information True sets geographic north as the north reference Grid sets grid north as the north reference 000 Magnetic sets the magnetic north as the no...

Страница 44: ...etween the connected devices If you select Clear User Data data is removed from both connected devices User Data Sharing Cable Wiring Diagram Item Wire Function Wire Color Data Blue Data Brown Item Wi...

Страница 45: ...u want to capture 4 Hold HOME for at least six seconds Copying Screenshots to a Computer 1 Remove the memory card from the chartplotter and insert it into a card reader that is attached to a computer...

Страница 46: ...rmation Transmit and Receive PGN Description 059392 ISO acknowledgment 059904 ISO request 060928 ISO address claim 126208 NMEA Command request and acknowledge group function 126996 Product information...

Страница 47: ...when you install the device or add an accessory to the device This device supports up to a 32 GB memory card formatted to FAT32 Before you update the software you can check to the software version ins...

Страница 48: ...ss signal device 8 DSC See digital selective calling E EGNOS 34 engine gauges 29 36 configuring 29 status alarms 29 EPIRB 8 event log 35 F factory settings 37 sonar 23 Fish Eye 3D 9 sonar cone 10 susp...

Страница 49: ...23 measuring distances 21 noise 21 23 overlay numbers 22 Panoptix 19 20 24 25 recording 22 scroll speed 22 sharing 21 SideV 18 source 21 surface noise 23 suspended targets 23 views 18 waypoint 21 whit...

Страница 50: ...support garmin com TA 2018 183 TA 2018 209 TA 2018 154 April 2019 190 02242 00_0E...

Отзывы: