


VIEWCOM/E MAX+ Web page
> Monitoring the detector boards
12
Monitoring the detector boards
Via the Web page menus
Detector Status
and
Real-time Data Analysis
, you can view an image of each detector
board. The canvas is colour-coded to indicate active events. If so, you can view event details. For each board with
traffic data function, integrated count, speed and occupancy data from the last 10 intervals are available per lane, and
are shown in a table or graph.
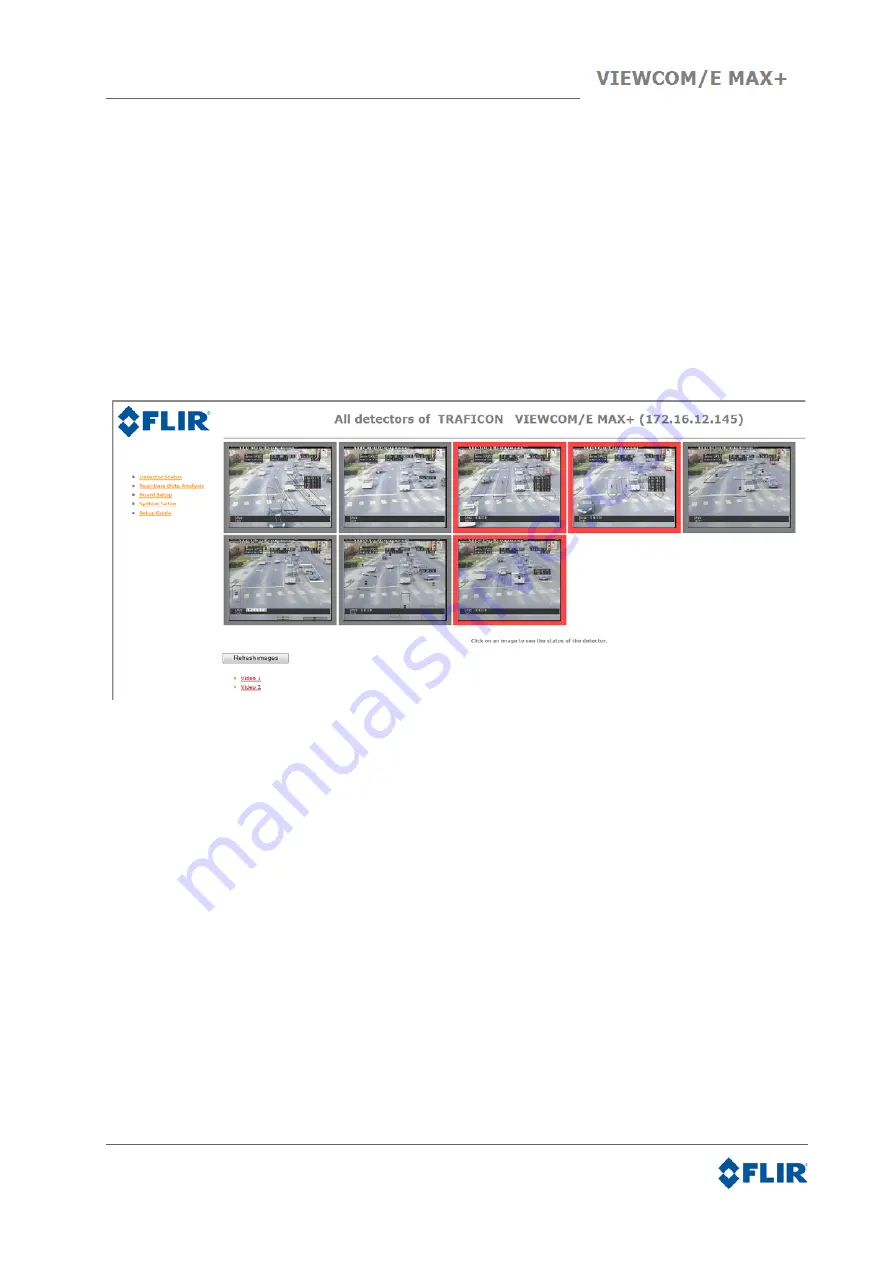
To view the status of all detector boards (image, event status)
1
Go to the Web page of VIEWCOM/E MAX+.
2
Click
Detector Status
.
GREY
= normal situation
RED
= active traffic event (e.g. Level of Service)
ORANGE
= active technical event (e. g. image quality)
3
To get details on the active event(s): click the camera image.


