Display Log Graph
Points • 83
8.4. Display Log Graph
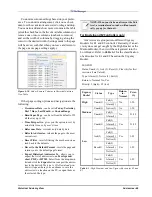
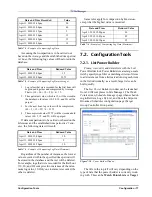
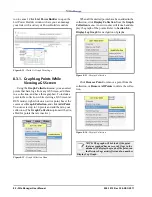
Point logs are properties inside the controller that
have been graphed. The Display Log Graph screen
will open and show a graph view of the data.
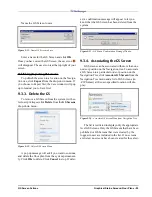
Once you have selected the points you wish to log
and have clicked the Display Log Graph button, or
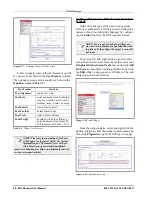
clicked on the Display Log Graph menu from the
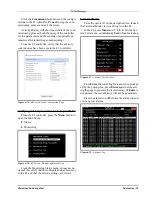
point on the navigation tree, the logged points will be
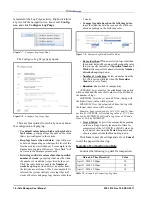
shown in a graph as shown in Figure 8-20.
8.4.1. Graphing Range
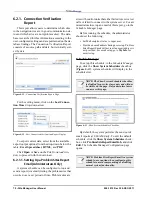
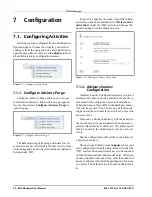
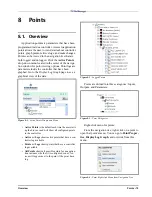
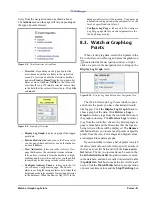
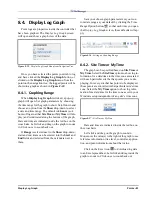
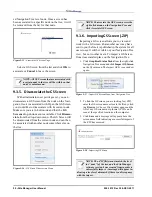
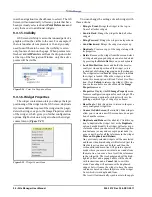
When Display Log Graph is clicked, a pop-up
graph will open. Set graph parameters by choosing
the time range for the graph to show. Scroll down and
choose an option from the Show drop-down to select
a date and time range. The default is 4 hours (so 4
hours of logs in either Site Time or My Time will dis-
play) and is indicated along the bottom of the graph.
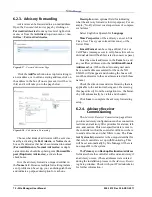
Date and time are indicated inside the red box on the
cross hairs. Left-click and drag on the graph to zoom
in. Click once to zoom back out.
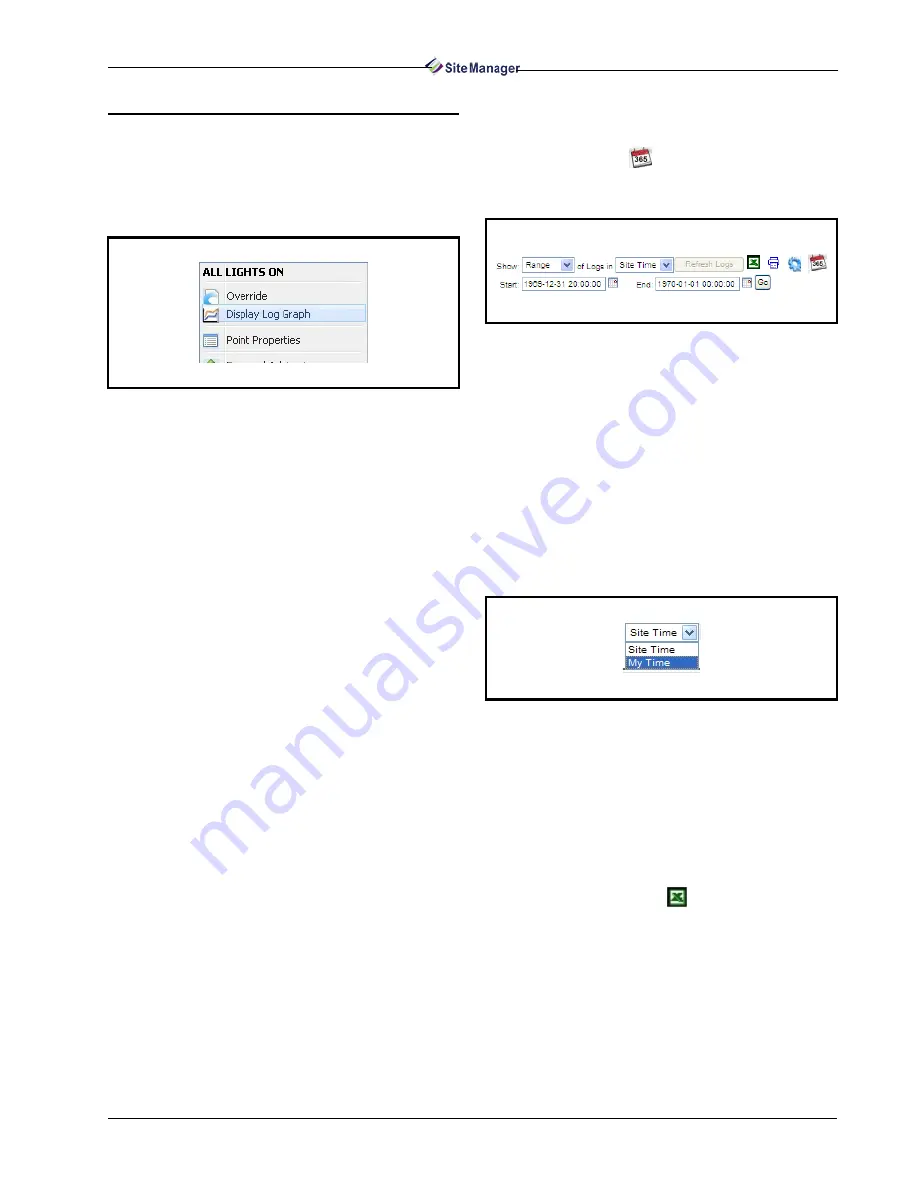
If Range is selected next to the Show drop-down,
start and end times can be entered into the Start and
End fields and selected from the calendars next to
them.
Save your chosen graph parameters or your cus-
tom date range as your default by clicking the Time
Range Option button,
so that each time you open
the Display Log Graph screen, these defaults will ap-
ply.
8.4.2. Site Time or My Time
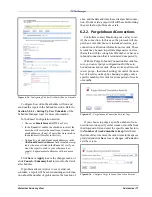
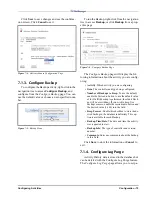
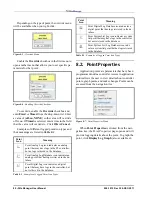
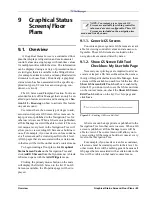
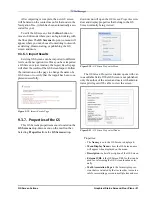
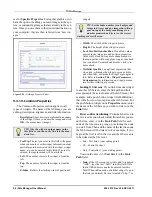
The graph can be specified based on Site Time or
My Time. Select the Site Time option to show log in-
formation for a date/time in the time zone associated
with each particular site that has points you are dis-
playing. For every site that has points to be displayed,
those points are converted to that particular site’s time
zone. Select the My Time option to show log infor-
mation for a date/time for the time zone as set in your
Windows setup independent of any site’s time zone.
Date and time are indicated inside the red box on
the cross hairs.
Left-click and drag on the graph to zoom in.
Mouse over the value(s) to the right of the graph to see
reference information (tree level, controller, applica-
tion, and point information) about that value.
Click on the Excel icon
to download log data
to an Excel spreadsheet. Left-click and drag inside the
graph to zoom in. Click once to zoom back out.
Figure 8-15 - Display Log Graph Menu from Navigation Tree
Figure 8-16 - Setting up Graphing Range
Figure 8-17 - Site Time or My Time
Содержание Site Manager
Страница 1: ...026 1012 Rev 3 06 DEC 2011 Site Manager User Manual ...
Страница 2: ......
Страница 4: ......
Страница 124: ......
Страница 129: ......

