mode
is activated and the graph will continuously
display the current values. If the right slider does not
touch the bar’s right edge, the sliders are grey and the
graph will only display the exact time period that is
selected.
5.2.1.1
Heatmap
The
heatmap
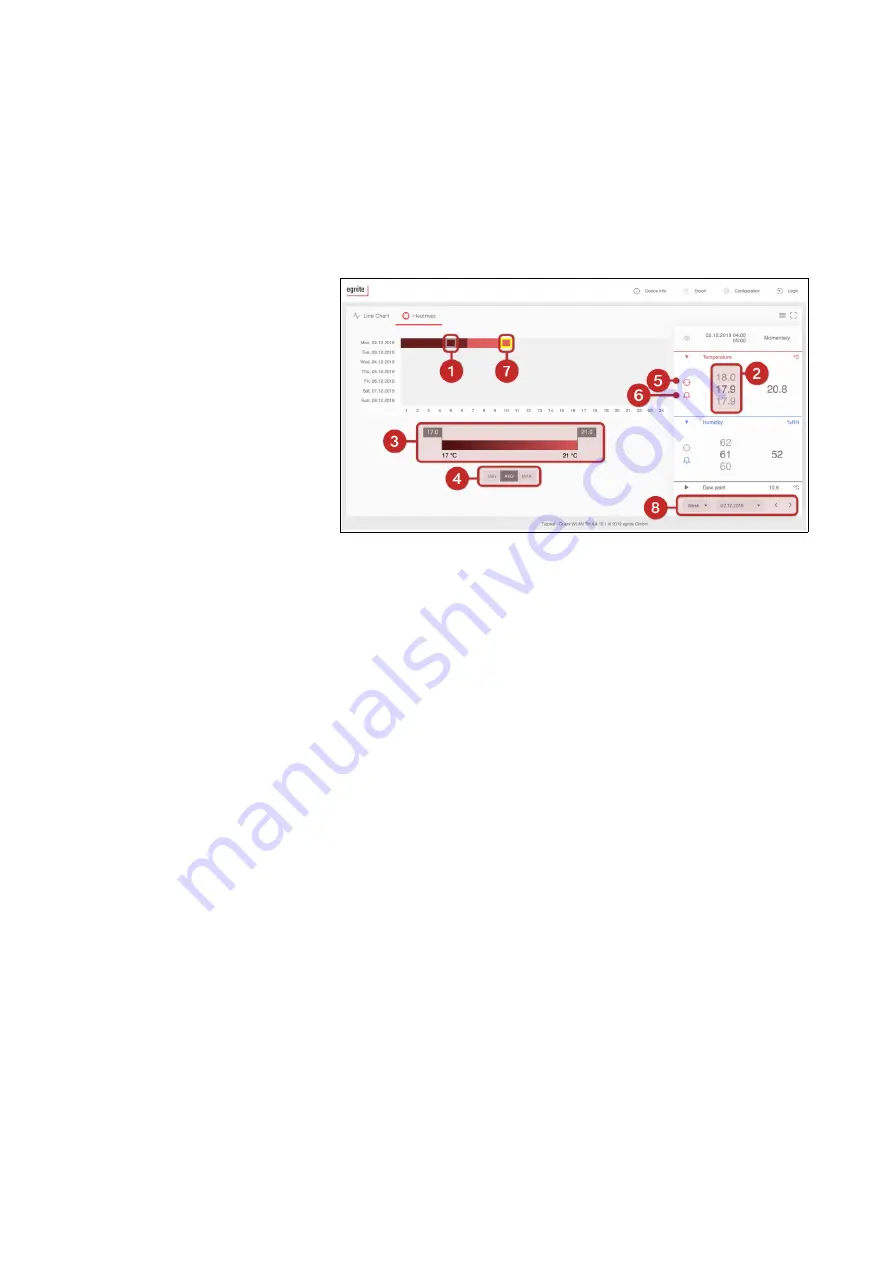
displays an annual overview in the form of
a calendar. Each day’s median values are color-coded.
Hovering the cursor over a
date
(1)
displays the
maximal
,
minimal
and
median
values
(2)
for the
selected day in the sidebar.
The heatmap’s color settings can be customized above
the
slider
(3)
at the screen’s lower edge. The shade of
color at the left end of the slider corresponds to the
year’s lowest value and the shade on the right
corresponds to the highest value. All values in between
are automatically allocated to the corresponding
shades. The
buttons
(4)
below the slider are used to
toggle between minimum, average or maximal values.
50
Auto-Update mode
Customizing the
display
Содержание EGN600114
Страница 96: ...93...
Страница 107: ...104...
Страница 124: ...12 1 6 2 THP Models Temperature Sensor Measuring range Typical Unit Accuracy 25 0 5 C 0 65 1 0 C 121...


