23
Getting Started
Edelbrock QwikData 2
Step 12. Open a Time Plot
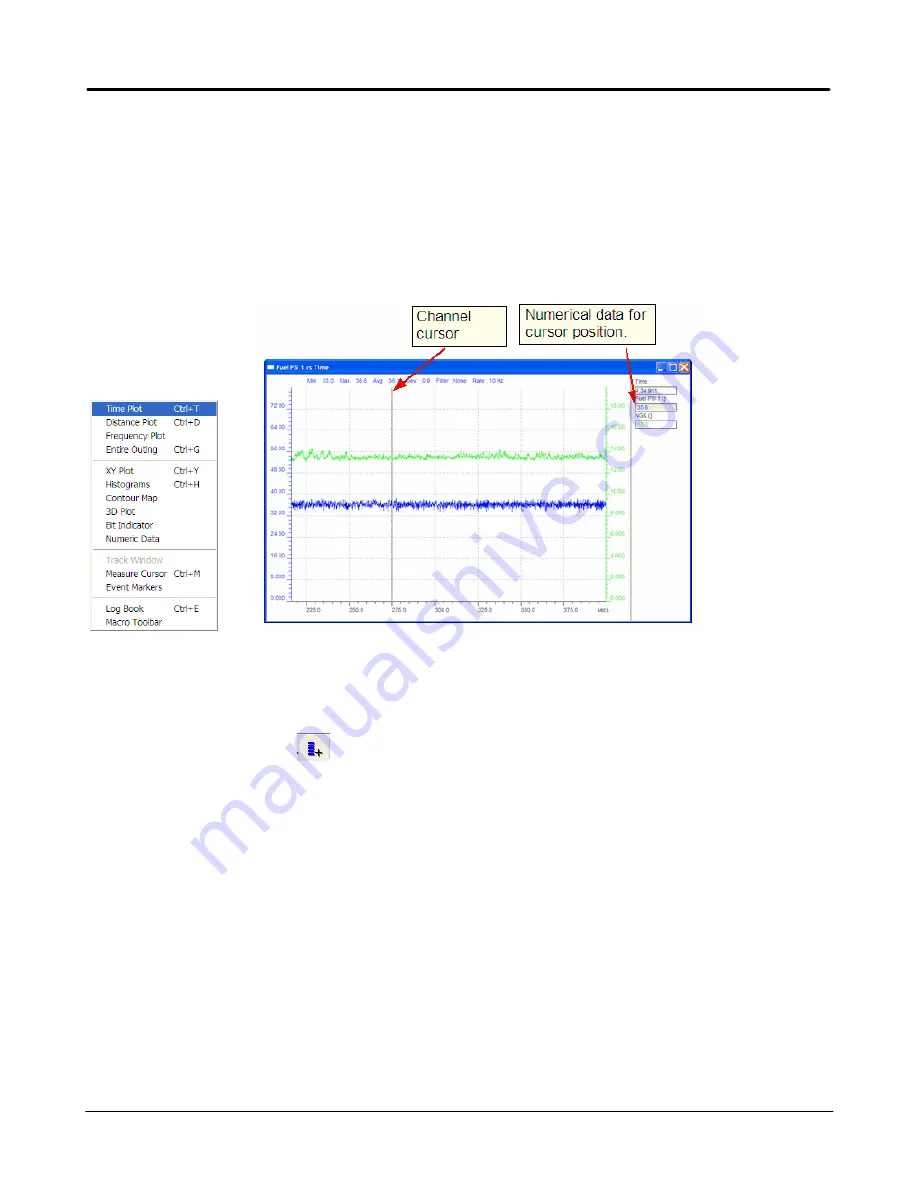
Use this function to display the time plot window. This plot is useful for looking at events that are independent
of the position of the track or when a wheel speed input is not available to plot against distance. Selected data
should display.
1. On the Menu Bar under View, click Time Plot.
The time plot window will open and display a graph of the channels loaded in the file folder plotted against
time. The scale for the current channel is displayed on the left axis and additional channel information is
displayed at the top of the graph.
Select the Add Channels Icon
from the menu bar to display a list of logged channels to display on the
graph.
2. Move the cursor horizontally to a point of interest.
3. Right click to open the zoom and scroll popup menu.
The channel numerical data for the current cursor location is displayed in the upper right corner of the window
and will update as the cursor is moved.
Notes
·
Clicking on a channel in the file folder makes it the new current channel.
·
Right click over the left axis to open the channel scaling popup menu.
Содержание QwikData 2
Страница 27: ...26 Getting Started Edelbrock QwikData 2 Suggested Harness Routing...
Страница 28: ...27 Getting Started Edelbrock QwikData 2 91290 Basic Analog Harness Details...
Страница 29: ...28 Getting Started Edelbrock QwikData 2 91290 Basic Harness Schematic...
Страница 31: ...30 Getting Started Edelbrock QwikData 2 91294 Advanced Thermocouple Harness Details...
Страница 32: ...31 Getting Started Edelbrock QwikData 2 91294 Advanced Thermocouple Harness Schematic...
Страница 34: ...33 Getting Started Edelbrock QwikData 2 91291 Advanced Analog Harness Details...
Страница 35: ...34 Getting Started Edelbrock QwikData 2 91291 Advanced Analog Harness Schematic...
Страница 39: ...38 Getting Started Edelbrock QwikData 2 User Notes...


