IL17574C
Page 4-4
Effective Date: 2/04
IQ 300
Page 4-4
Effective Date: 2/04
For more information visit:
www.cutler-hammer.eaton.com
4.5
USING THE OPERATOR PANEL
When the IQ 300 is first powered on, the Operator Panel screen displays a brief
initialization message identifying the product and version. The screen then displays
the System Power screen. (At this point, pressing the
Scroll
arrows will display
system data as described in
section 4.6 System Data Display Mode.
)
Press the
Menu
button to proceed. The menu options are shown one at a time,
starting with Phase Data, see figure 4.2. Press the scroll up or down arrows to step
through all the main menu options. The presence of additional items is indicated by
the up and down triangles at the bottom right edge of the screen.
Keep in mind that the
values
displayed under several menu items depend on which
unit you are using and whether the system being monitored is 3 or 4 wire, and
require that the appropriate configuration be selected under the
Edit Setpoints
menu. Menu descriptions cover both 3 and 4 wire systems where appropriate.
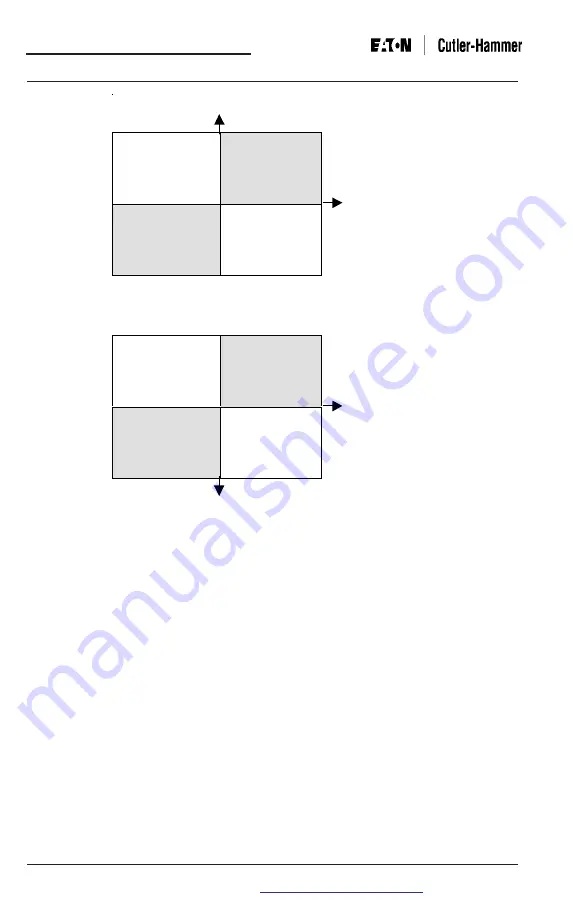
Note:
The lagging or leading indicator and any signs may be the opposite of that
shown in the sample screens.
Quadrant 2
Watts negative
Vars positive
Power Factor (-)
Lagging
Quadrant 1
Watts positive
Vars positive
Power Factor (+)
Leading
Quadrant 3
Watts negative
Vars negative
Power Factor (+)
Leading
Quadrant 4
Watts positive
Vars negative
Power Factor (-)
Lagging
Quadrant 2
Watts negative
Vars negative
Power Factor (+)
Lagging
Quadrant 1
Watts positive
Vars negative
Power Factor (-)
Leading
Quadrant 3
Watts negative
Vars positive
Power Factor (-)
Leading
Quadrant 4
Watts positive
Vars positive
Power Factor (+)
Lagging
Reactive Power
Real Power
Mathematical Convention
Reactive Power
Real Power
Power Engineer Convention
Figure 4.1 System Power Value Relationships


