


Manual, Ultra High Sensitivity Aerosol Spectrometer (UHSAS)
DOC-0210 Rev E-4
4 4
© 2017 DROPLET MEASUREMENT TECHNOLOGIES
10.0
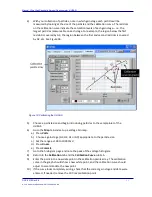
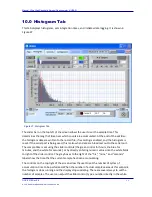
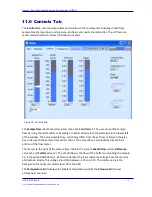
Histogram Tab
This tab displays histograms, sets integration times, and initiates data logging. It is shown in
The slider bar on the top left of the screen allows the user to set the sample time. This
determines the length of time over which counts are accumulated. At the end of the set time,
the histogram data are written to the record file, if recording is enabled, and the histogram is
reset. If the serial port is being used, this is also when data are broadcast out to the serial port.
The sample time is set using the slider controls (the green control for hours, the blue for
minutes, and the white for seconds), or by directly entering numeric values into the white fields
to right of the slider control. The gray boxes to the right of the “hrs,” “mins,” and “seconds”
labels show the time that the current sample has been accumulating.
The controls on the top right of the screen allow the user to set the number of cycles of
accumulation time to be performed. When the number of actual samples exceeds this set point,
the histogram stops running and the display stops updating. There are several ways to set the
number of samples. The user can adjust the slider control, type a number directly in the white
Figure 27: Histogram Tab


