Introducing the MSQ
_______________________________________________________________________The Data System
RT:
1.09 - 6.11
1.5
2.0
2.5
3.0
3.5
4.0
4.5
5.0
5.5
6.0
Time (min)
0
20
40
60
80
100
R
el
a
tiv
e A
bun
da
nc
e
2.66
2.82
3.59
2.35
3.28
3.72
1.24 1.55
2.25
4.75
3.87
5.17
4.18
5.32 5.42
NL:
2.49E5
TIC carb
mix pmix03
carb mix pmix03
#
102
RT:
2.66
AV:
1
SB:
38 1.42-2.07, 2.87-3.15
NL:
1.02E5
T:
+ c ESI Full ms [ 150.00-500.00]
150
200
250
300
350
400
450
500
m/z
0
20
40
60
80
100
R
e
la
tiv
e
A
bunda
nc
e
281.2
459.1
240.3
282.5
454.1 461.0
256.2
229.4
346.8
403.2
181.5
387.0
482.1
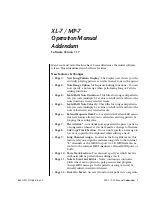
Figure 1-25. A mass spectrum taken at retention time 2.66 minutes
(lower trace) from a TIC chromatogram (upper trace)
Raw Data Types
The data can be collected and stored by the data system in two different
ways: Full Scan and Selected Ion Monitoring (SIM). The main difference
between these two modes is:
In Full Scan mode, data is collected across the whole scan range.
•
•
In SIM mode, data is acquired only at specific mass-to-charge ratios.
___________________________MSQ Hardware Manual ___________________________
1-31