Terminal Interface
4-9
4
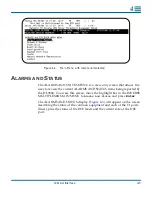
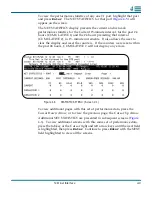
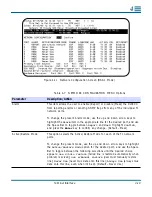
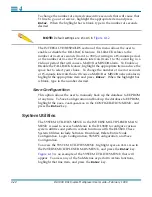
To view the performance statistics of any one T1 port, highlight that port
and press
Enter
. The NET STATISTICS for that port (
Figure 4-5
) will
appear on the screen.
The NET STATISTICS display presents the current and network
performance statistics for the Current 15-minute interval, for the past 24
hours (CUMULATIVE 1) and the 24 hours preceding that interval
(CUMULATIVE 2), in 15- minute increments. It also allows the user to
clear the display and reset the counters. If the counters were reset within
the past 24 hours, CUMULATIVE 2 will not display any errors.
Figure 4-5
STATISTICS MENU (Screen #1)
To view additional pages with this set of performance data, press the
Cursor Down Arrow, or to view the previous page, the Cursor Up Arrow.
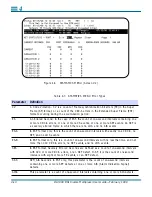
Additional NET STATISTICS are presented in subsequent screens (
Figure
4-6
). To view additional screens with this same set of performance data,
press the tab key or the Cursor right and left arrow keys until the next Þeld
is highlighted, then press
Enter
. Continue to press
Enter
with the NEXT
Þeld highlighted to view all the screens.
Содержание DL3800 DS1
Страница 1: ...DL3800 DS1 Inverse Multiplexer User Guide Part 098 10380 01 Rev J February 1999...
Страница 6: ...vi DL3800 DS1 Inverse Multiplexer User Guide February 1999...
Страница 12: ...Table of Contents xii...
Страница 22: ...xxii DL3800 DS1 Inverse Multiplexer User Guide February 1999...
Страница 26: ...1 4 DL3800 DS1 Inverse Multiplexer User Guide February 1999 1...
Страница 34: ...2 8 DL3800 DS1 Inverse Multiplexer User Guide February 1999 2...
Страница 128: ...C 4 DL3800 DS1 Inverse Multiplexer User Guide February 1999 C...

