- 31 -
65 Aleksandar Stamboliyski Str., 8000 Bourgas, Bulgaria
Tel: +359 56 820027, Fax: +359 56 836700
E-mail: [email protected] ,Web: www.devabroadcast.com
Telemetry and Telecontrol
WEB INTERFACE – HOME
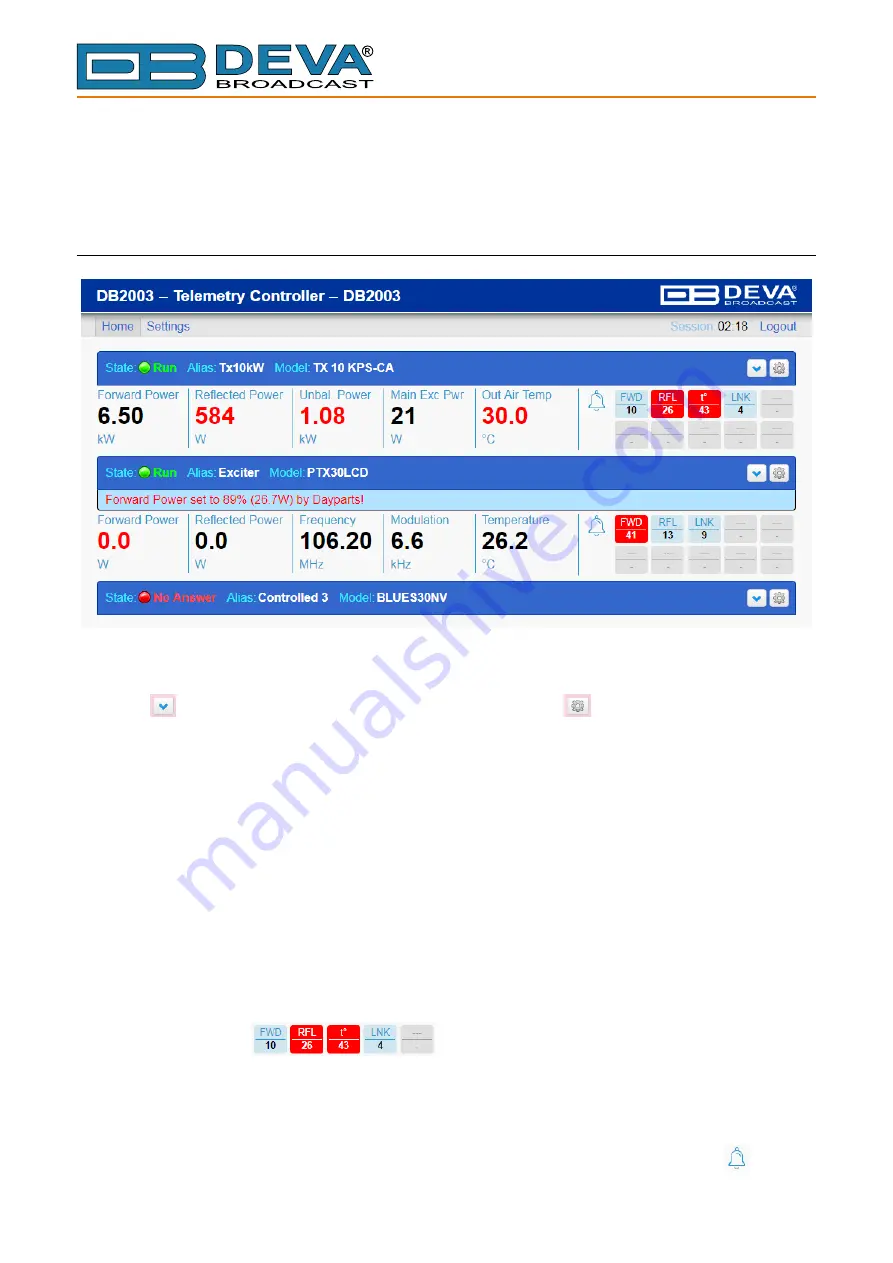
The image above shows the main panel of the WEB interface for three allowed Telemetry Ports.
The upper section contains the bar showing the port status, as well as the Alias and model of the
monitored device. On the right-hand side of the bar are the button that displays/hides the read signal
values
and the button that displays telecontrol parameters
. When the user has no admin
rights, this button is not active. The middle section shows the blue bar, which indicates enabled
Dayparts, as well as the power currently set.
Next comes the field with the five main signals. They differ in accordance with the model of the
selected monitored device. The right-hand section of the field shows the indicators for the enabled
alarms. If the status is different from Run, this section is not displayed, as illustrated by the lower
section of the image for Telemetry Port 3.
NOTE
: Screenshots are taken from simulated devices, rather than monitored ones in actual
operation. The signal values in the images may therefore not be consistent.
The values of the main signals get highlighted in red when the set alarm thresholds are passed.
This happens even when the alarm is not Enabled – as illustrated by Unbalanced Power in the upper
section of the image. The value is in red but there is no Unbalanced Power alarm indicator on the
right. The value becomes highlighted as soon as the threshold is passed, while the alarm becomes
active once the Trigger Time elapses. The value returns to black as soon as the signal is restored to
normal, while the alarm will remain on until the Release Time elapses.
Alarm indicators
. The gray field is a placeholder, with no Enabled
alarm. The pink ones indicate which alarms have been enabled, as well as the current Idle status.
The number below the line shows the number of times the alarm has been activated after the latest
resetting. The indicators in red show active alarms. The alarm abbreviations are shown in the Alarms
List table.
Click or tap on the Alarm indicator to reset single alarm counter. Click or tap on the
bell icon
to reset all alarm counters on this telemetry port.
Содержание DB2003
Страница 4: ...THIS PAGE IS INTENTIONALLY LEFT BLANK ...


